Central American Indian vs Immigrants from Haiti Divorced or Separated
COMPARE
Central American Indian
Immigrants from Haiti
Divorced or Separated
Divorced or Separated Comparison
Central American Indians
Immigrants from Haiti
12.7%
DIVORCED OR SEPARATED
0.3/ 100
METRIC RATING
275th/ 347
METRIC RANK
13.4%
DIVORCED OR SEPARATED
0.0/ 100
METRIC RATING
322nd/ 347
METRIC RANK
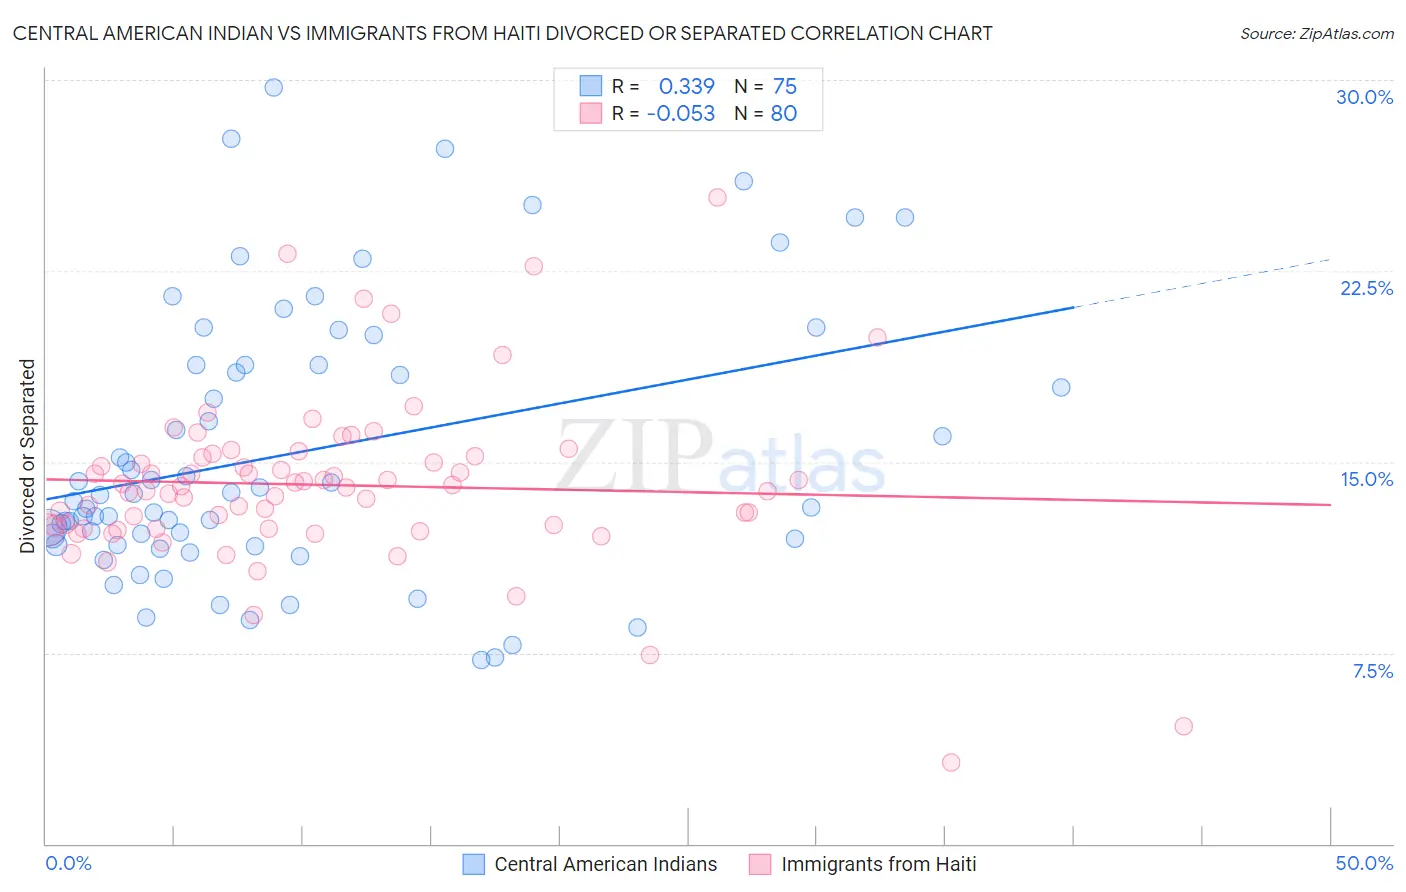
Central American Indian vs Immigrants from Haiti Divorced or Separated Correlation Chart
The statistical analysis conducted on geographies consisting of 326,087,171 people shows a mild positive correlation between the proportion of Central American Indians and percentage of population currently divorced or separated in the United States with a correlation coefficient (R) of 0.339 and weighted average of 12.7%. Similarly, the statistical analysis conducted on geographies consisting of 225,208,524 people shows a slight negative correlation between the proportion of Immigrants from Haiti and percentage of population currently divorced or separated in the United States with a correlation coefficient (R) of -0.053 and weighted average of 13.4%, a difference of 5.8%.
Divorced or Separated Correlation Summary
| Measurement | Central American Indian | Immigrants from Haiti |
| Minimum | 7.2% | 3.2% |
| Maximum | 29.7% | 25.4% |
| Range | 22.5% | 22.2% |
| Mean | 15.3% | 14.1% |
| Median | 13.7% | 14.0% |
| Interquartile 25% (IQ1) | 11.7% | 12.4% |
| Interquartile 75% (IQ3) | 18.8% | 15.2% |
| Interquartile Range (IQR) | 7.1% | 2.8% |
| Standard Deviation (Sample) | 5.3% | 3.4% |
| Standard Deviation (Population) | 5.3% | 3.4% |
Similar Demographics by Divorced or Separated
Demographics Similar to Central American Indians by Divorced or Separated
In terms of divorced or separated, the demographic groups most similar to Central American Indians are Bermudan (12.7%, a difference of 0.020%), Immigrants from Micronesia (12.7%, a difference of 0.040%), Spaniard (12.7%, a difference of 0.060%), Dominican (12.7%, a difference of 0.11%), and Immigrants from Middle Africa (12.7%, a difference of 0.16%).
| Demographics | Rating | Rank | Divorced or Separated |
| Fijians | 0.4 /100 | #268 | Tragic 12.6% |
| Immigrants | Liberia | 0.4 /100 | #269 | Tragic 12.6% |
| Ute | 0.4 /100 | #270 | Tragic 12.6% |
| Panamanians | 0.3 /100 | #271 | Tragic 12.7% |
| Immigrants | Middle Africa | 0.3 /100 | #272 | Tragic 12.7% |
| Immigrants | Micronesia | 0.3 /100 | #273 | Tragic 12.7% |
| Bermudans | 0.3 /100 | #274 | Tragic 12.7% |
| Central American Indians | 0.3 /100 | #275 | Tragic 12.7% |
| Spaniards | 0.2 /100 | #276 | Tragic 12.7% |
| Dominicans | 0.2 /100 | #277 | Tragic 12.7% |
| Lumbee | 0.2 /100 | #278 | Tragic 12.7% |
| Immigrants | Dominican Republic | 0.2 /100 | #279 | Tragic 12.7% |
| Immigrants | Zaire | 0.2 /100 | #280 | Tragic 12.7% |
| Pueblo | 0.2 /100 | #281 | Tragic 12.7% |
| Sub-Saharan Africans | 0.1 /100 | #282 | Tragic 12.7% |
Demographics Similar to Immigrants from Haiti by Divorced or Separated
In terms of divorced or separated, the demographic groups most similar to Immigrants from Haiti are U.S. Virgin Islander (13.4%, a difference of 0.22%), Cheyenne (13.4%, a difference of 0.24%), Osage (13.4%, a difference of 0.29%), Cajun (13.4%, a difference of 0.34%), and Potawatomi (13.5%, a difference of 0.35%).
| Demographics | Rating | Rank | Divorced or Separated |
| Spanish Americans | 0.0 /100 | #315 | Tragic 13.3% |
| Tsimshian | 0.0 /100 | #316 | Tragic 13.3% |
| Haitians | 0.0 /100 | #317 | Tragic 13.3% |
| Cree | 0.0 /100 | #318 | Tragic 13.4% |
| Puget Sound Salish | 0.0 /100 | #319 | Tragic 13.4% |
| Cajuns | 0.0 /100 | #320 | Tragic 13.4% |
| Cheyenne | 0.0 /100 | #321 | Tragic 13.4% |
| Immigrants | Haiti | 0.0 /100 | #322 | Tragic 13.4% |
| U.S. Virgin Islanders | 0.0 /100 | #323 | Tragic 13.4% |
| Osage | 0.0 /100 | #324 | Tragic 13.4% |
| Potawatomi | 0.0 /100 | #325 | Tragic 13.5% |
| Immigrants | Congo | 0.0 /100 | #326 | Tragic 13.5% |
| Comanche | 0.0 /100 | #327 | Tragic 13.5% |
| Immigrants | Caribbean | 0.0 /100 | #328 | Tragic 13.6% |
| Houma | 0.0 /100 | #329 | Tragic 13.6% |