Immigrants from Asia vs Immigrants from Haiti Divorced or Separated
COMPARE
Immigrants from Asia
Immigrants from Haiti
Divorced or Separated
Divorced or Separated Comparison
Immigrants from Asia
Immigrants from Haiti
10.7%
DIVORCED OR SEPARATED
100.0/ 100
METRIC RATING
21st/ 347
METRIC RANK
13.4%
DIVORCED OR SEPARATED
0.0/ 100
METRIC RATING
322nd/ 347
METRIC RANK
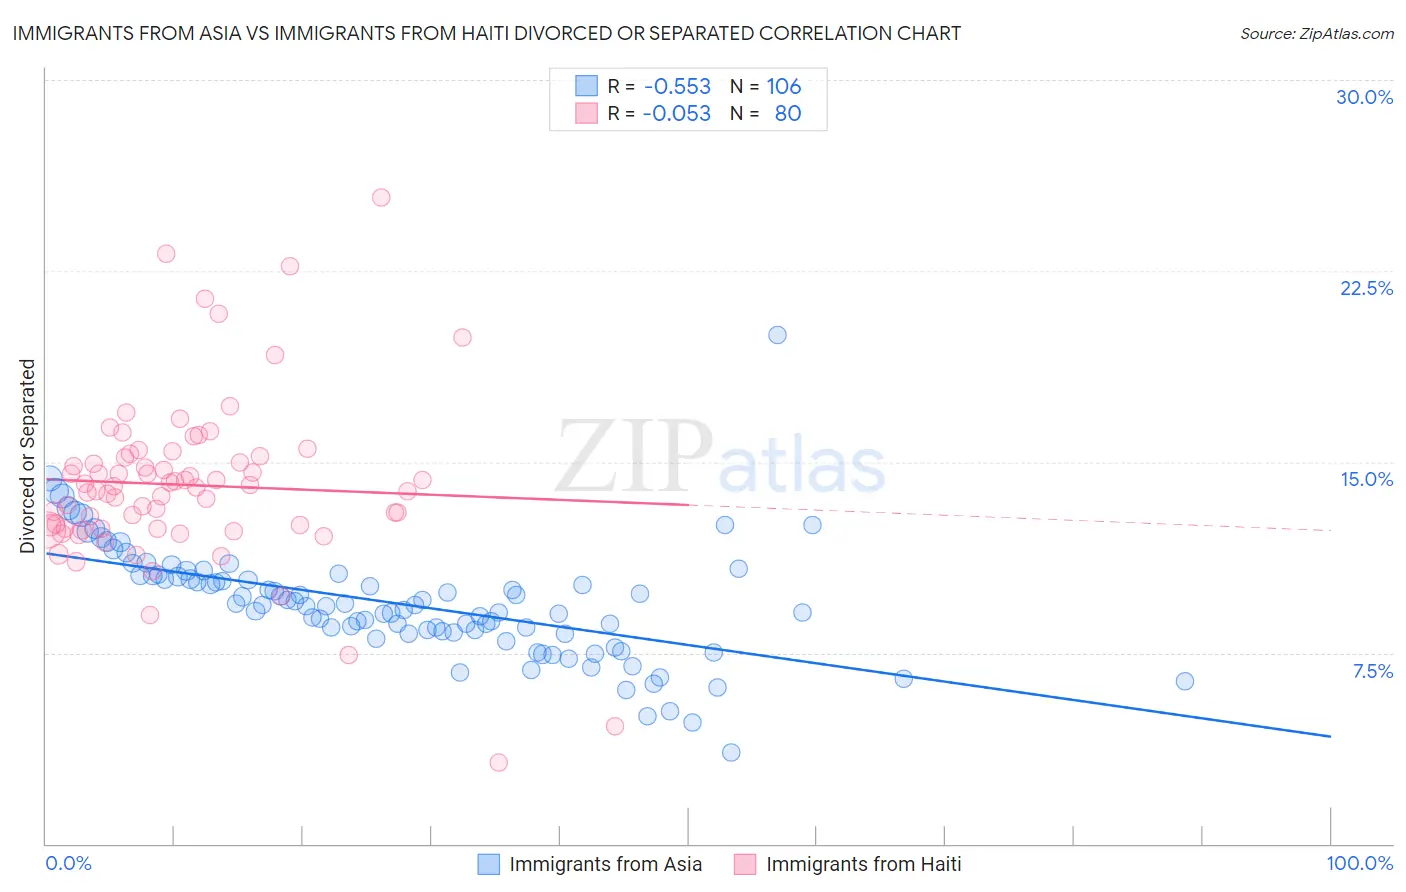
Immigrants from Asia vs Immigrants from Haiti Divorced or Separated Correlation Chart
The statistical analysis conducted on geographies consisting of 548,726,579 people shows a substantial negative correlation between the proportion of Immigrants from Asia and percentage of population currently divorced or separated in the United States with a correlation coefficient (R) of -0.553 and weighted average of 10.7%. Similarly, the statistical analysis conducted on geographies consisting of 225,208,524 people shows a slight negative correlation between the proportion of Immigrants from Haiti and percentage of population currently divorced or separated in the United States with a correlation coefficient (R) of -0.053 and weighted average of 13.4%, a difference of 24.9%.
Divorced or Separated Correlation Summary
| Measurement | Immigrants from Asia | Immigrants from Haiti |
| Minimum | 3.6% | 3.2% |
| Maximum | 20.0% | 25.4% |
| Range | 16.4% | 22.2% |
| Mean | 9.4% | 14.1% |
| Median | 9.4% | 14.0% |
| Interquartile 25% (IQ1) | 8.3% | 12.4% |
| Interquartile 75% (IQ3) | 10.5% | 15.2% |
| Interquartile Range (IQR) | 2.2% | 2.8% |
| Standard Deviation (Sample) | 2.3% | 3.4% |
| Standard Deviation (Population) | 2.2% | 3.4% |
Similar Demographics by Divorced or Separated
Demographics Similar to Immigrants from Asia by Divorced or Separated
In terms of divorced or separated, the demographic groups most similar to Immigrants from Asia are Burmese (10.7%, a difference of 0.18%), Vietnamese (10.8%, a difference of 0.26%), Immigrants from Pakistan (10.8%, a difference of 0.43%), Immigrants from Sri Lanka (10.8%, a difference of 0.63%), and Iranian (10.8%, a difference of 0.68%).
| Demographics | Rating | Rank | Divorced or Separated |
| Assyrians/Chaldeans/Syriacs | 100.0 /100 | #14 | Exceptional 10.6% |
| Immigrants | Armenia | 100.0 /100 | #15 | Exceptional 10.6% |
| Immigrants | Korea | 100.0 /100 | #16 | Exceptional 10.6% |
| Immigrants | Israel | 100.0 /100 | #17 | Exceptional 10.6% |
| Immigrants | Iran | 100.0 /100 | #18 | Exceptional 10.6% |
| Asians | 100.0 /100 | #19 | Exceptional 10.6% |
| Burmese | 100.0 /100 | #20 | Exceptional 10.7% |
| Immigrants | Asia | 100.0 /100 | #21 | Exceptional 10.7% |
| Vietnamese | 100.0 /100 | #22 | Exceptional 10.8% |
| Immigrants | Pakistan | 100.0 /100 | #23 | Exceptional 10.8% |
| Immigrants | Sri Lanka | 100.0 /100 | #24 | Exceptional 10.8% |
| Iranians | 100.0 /100 | #25 | Exceptional 10.8% |
| Immigrants | Indonesia | 100.0 /100 | #26 | Exceptional 10.9% |
| Immigrants | Bangladesh | 100.0 /100 | #27 | Exceptional 11.0% |
| Immigrants | Malaysia | 100.0 /100 | #28 | Exceptional 11.0% |
Demographics Similar to Immigrants from Haiti by Divorced or Separated
In terms of divorced or separated, the demographic groups most similar to Immigrants from Haiti are U.S. Virgin Islander (13.4%, a difference of 0.22%), Cheyenne (13.4%, a difference of 0.24%), Osage (13.4%, a difference of 0.29%), Cajun (13.4%, a difference of 0.34%), and Potawatomi (13.5%, a difference of 0.35%).
| Demographics | Rating | Rank | Divorced or Separated |
| Spanish Americans | 0.0 /100 | #315 | Tragic 13.3% |
| Tsimshian | 0.0 /100 | #316 | Tragic 13.3% |
| Haitians | 0.0 /100 | #317 | Tragic 13.3% |
| Cree | 0.0 /100 | #318 | Tragic 13.4% |
| Puget Sound Salish | 0.0 /100 | #319 | Tragic 13.4% |
| Cajuns | 0.0 /100 | #320 | Tragic 13.4% |
| Cheyenne | 0.0 /100 | #321 | Tragic 13.4% |
| Immigrants | Haiti | 0.0 /100 | #322 | Tragic 13.4% |
| U.S. Virgin Islanders | 0.0 /100 | #323 | Tragic 13.4% |
| Osage | 0.0 /100 | #324 | Tragic 13.4% |
| Potawatomi | 0.0 /100 | #325 | Tragic 13.5% |
| Immigrants | Congo | 0.0 /100 | #326 | Tragic 13.5% |
| Comanche | 0.0 /100 | #327 | Tragic 13.5% |
| Immigrants | Caribbean | 0.0 /100 | #328 | Tragic 13.6% |
| Houma | 0.0 /100 | #329 | Tragic 13.6% |