Cape Verdean vs Immigrants from Haiti Divorced or Separated
COMPARE
Cape Verdean
Immigrants from Haiti
Divorced or Separated
Divorced or Separated Comparison
Cape Verdeans
Immigrants from Haiti
13.1%
DIVORCED OR SEPARATED
0.0/ 100
METRIC RATING
303rd/ 347
METRIC RANK
13.4%
DIVORCED OR SEPARATED
0.0/ 100
METRIC RATING
322nd/ 347
METRIC RANK
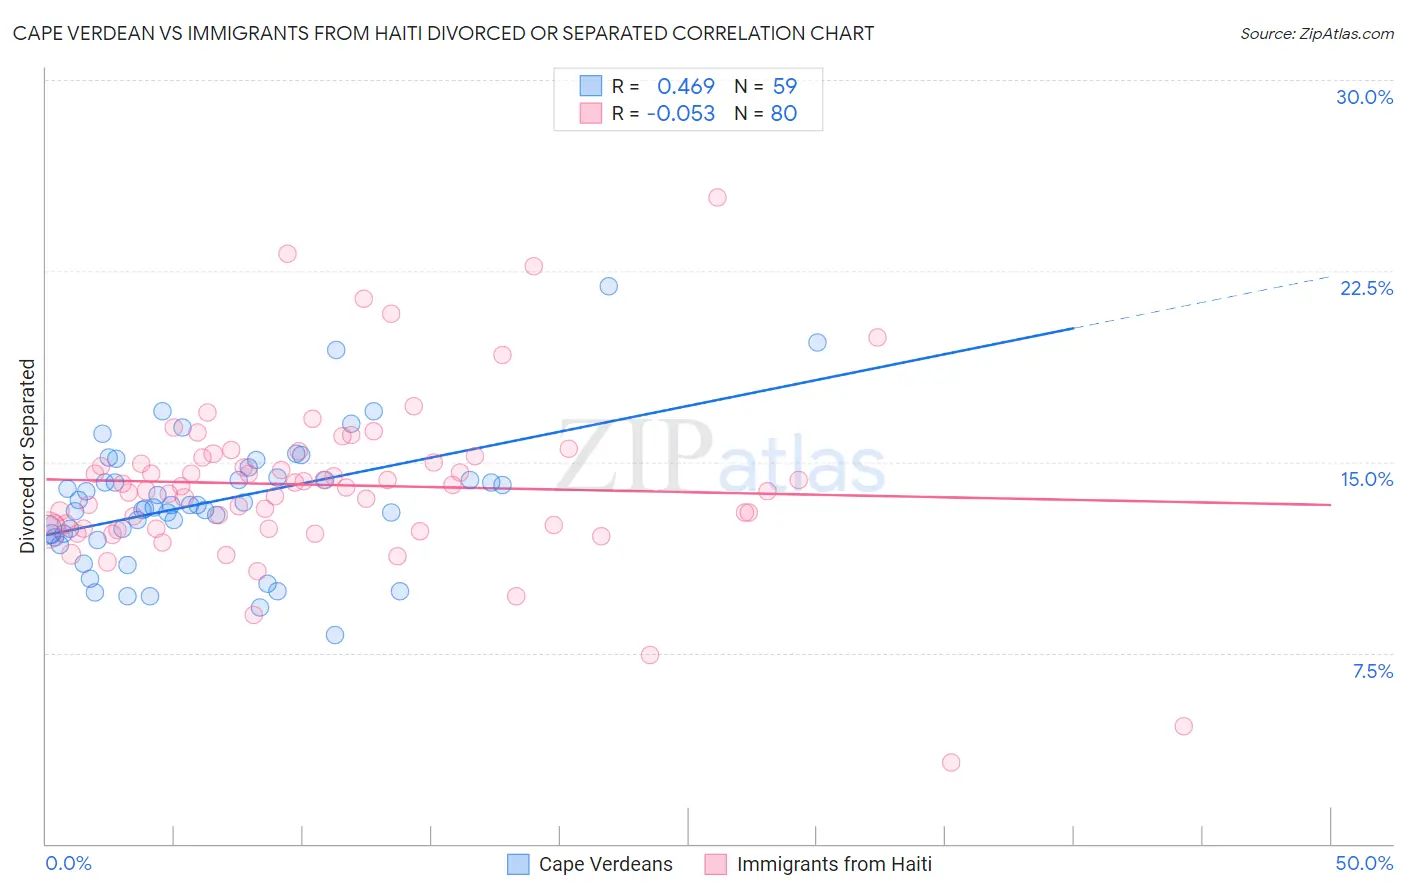
Cape Verdean vs Immigrants from Haiti Divorced or Separated Correlation Chart
The statistical analysis conducted on geographies consisting of 107,557,736 people shows a moderate positive correlation between the proportion of Cape Verdeans and percentage of population currently divorced or separated in the United States with a correlation coefficient (R) of 0.469 and weighted average of 13.1%. Similarly, the statistical analysis conducted on geographies consisting of 225,208,524 people shows a slight negative correlation between the proportion of Immigrants from Haiti and percentage of population currently divorced or separated in the United States with a correlation coefficient (R) of -0.053 and weighted average of 13.4%, a difference of 2.1%.
Divorced or Separated Correlation Summary
| Measurement | Cape Verdean | Immigrants from Haiti |
| Minimum | 8.2% | 3.2% |
| Maximum | 21.9% | 25.4% |
| Range | 13.7% | 22.2% |
| Mean | 13.4% | 14.1% |
| Median | 13.3% | 14.0% |
| Interquartile 25% (IQ1) | 12.2% | 12.4% |
| Interquartile 75% (IQ3) | 14.4% | 15.2% |
| Interquartile Range (IQR) | 2.2% | 2.8% |
| Standard Deviation (Sample) | 2.6% | 3.4% |
| Standard Deviation (Population) | 2.5% | 3.4% |
Demographics Similar to Cape Verdeans and Immigrants from Haiti by Divorced or Separated
In terms of divorced or separated, the demographic groups most similar to Cape Verdeans are Immigrants from Venezuela (13.1%, a difference of 0.020%), Hopi (13.2%, a difference of 0.13%), Chippewa (13.2%, a difference of 0.18%), Tlingit-Haida (13.2%, a difference of 0.35%), and French American Indian (13.2%, a difference of 0.60%). Similarly, the demographic groups most similar to Immigrants from Haiti are Cheyenne (13.4%, a difference of 0.24%), Cajun (13.4%, a difference of 0.34%), Puget Sound Salish (13.4%, a difference of 0.40%), Cree (13.4%, a difference of 0.44%), and Haitian (13.3%, a difference of 0.47%).
| Demographics | Rating | Rank | Divorced or Separated |
| Immigrants | Venezuela | 0.0 /100 | #302 | Tragic 13.1% |
| Cape Verdeans | 0.0 /100 | #303 | Tragic 13.1% |
| Hopi | 0.0 /100 | #304 | Tragic 13.2% |
| Chippewa | 0.0 /100 | #305 | Tragic 13.2% |
| Tlingit-Haida | 0.0 /100 | #306 | Tragic 13.2% |
| French American Indians | 0.0 /100 | #307 | Tragic 13.2% |
| Ottawa | 0.0 /100 | #308 | Tragic 13.2% |
| Americans | 0.0 /100 | #309 | Tragic 13.2% |
| Africans | 0.0 /100 | #310 | Tragic 13.2% |
| Sioux | 0.0 /100 | #311 | Tragic 13.2% |
| Blackfeet | 0.0 /100 | #312 | Tragic 13.3% |
| Immigrants | Nicaragua | 0.0 /100 | #313 | Tragic 13.3% |
| Yaqui | 0.0 /100 | #314 | Tragic 13.3% |
| Spanish Americans | 0.0 /100 | #315 | Tragic 13.3% |
| Tsimshian | 0.0 /100 | #316 | Tragic 13.3% |
| Haitians | 0.0 /100 | #317 | Tragic 13.3% |
| Cree | 0.0 /100 | #318 | Tragic 13.4% |
| Puget Sound Salish | 0.0 /100 | #319 | Tragic 13.4% |
| Cajuns | 0.0 /100 | #320 | Tragic 13.4% |
| Cheyenne | 0.0 /100 | #321 | Tragic 13.4% |
| Immigrants | Haiti | 0.0 /100 | #322 | Tragic 13.4% |