Cypriot vs Immigrants from Ecuador Child Poverty Under the Age of 5
COMPARE
Cypriot
Immigrants from Ecuador
Child Poverty Under the Age of 5
Child Poverty Under the Age of 5 Comparison
Cypriots
Immigrants from Ecuador
14.0%
CHILD POVERTY UNDER THE AGE OF 5
99.9/ 100
METRIC RATING
25th/ 347
METRIC RANK
19.6%
CHILD POVERTY UNDER THE AGE OF 5
0.5/ 100
METRIC RATING
240th/ 347
METRIC RANK
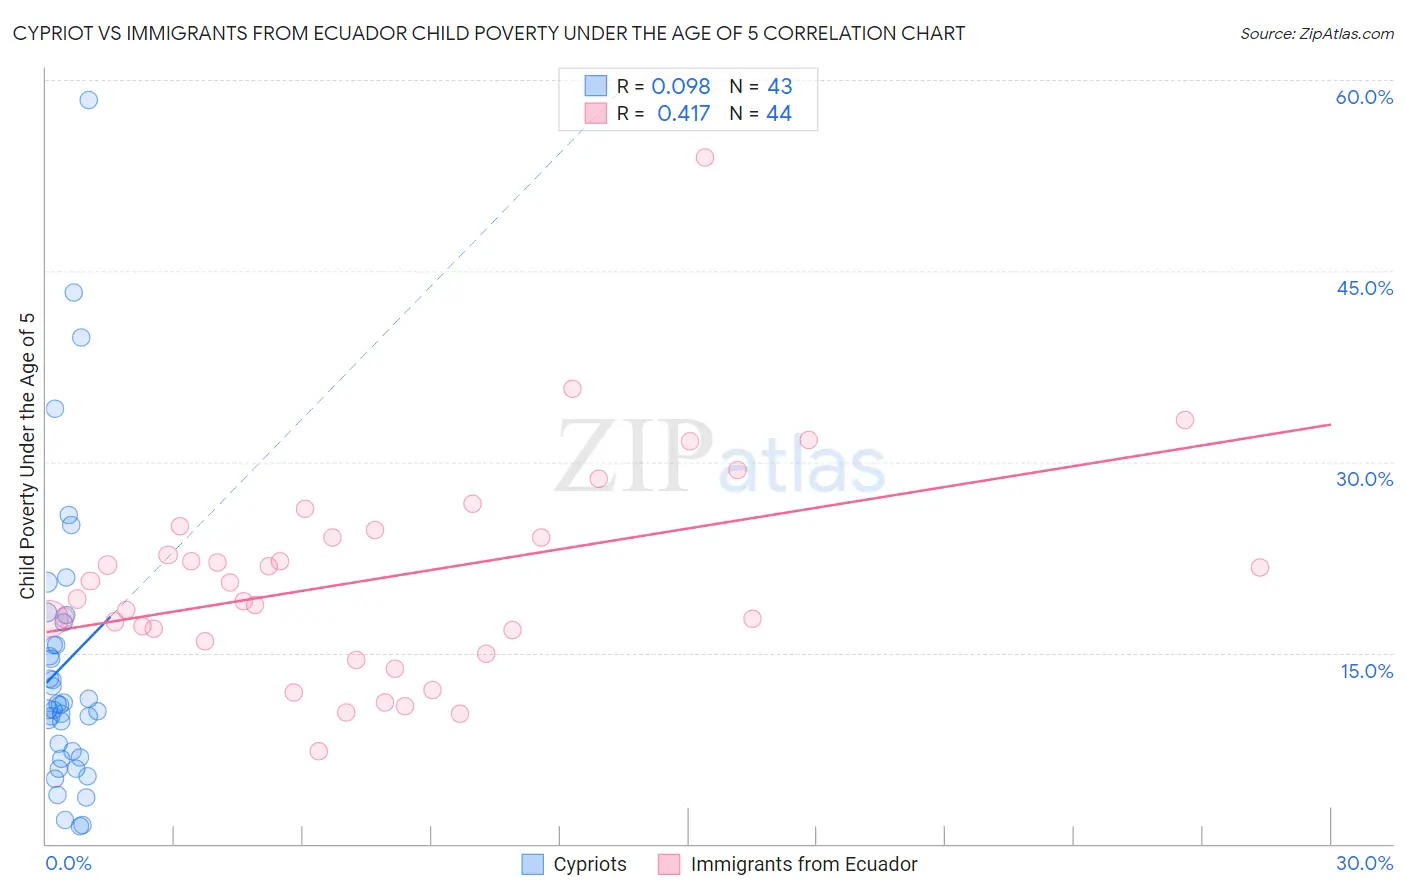
Cypriot vs Immigrants from Ecuador Child Poverty Under the Age of 5 Correlation Chart
The statistical analysis conducted on geographies consisting of 60,873,789 people shows a slight positive correlation between the proportion of Cypriots and poverty level among children under the age of 5 in the United States with a correlation coefficient (R) of 0.098 and weighted average of 14.0%. Similarly, the statistical analysis conducted on geographies consisting of 262,656,559 people shows a moderate positive correlation between the proportion of Immigrants from Ecuador and poverty level among children under the age of 5 in the United States with a correlation coefficient (R) of 0.417 and weighted average of 19.6%, a difference of 40.3%.
Child Poverty Under the Age of 5 Correlation Summary
| Measurement | Cypriot | Immigrants from Ecuador |
| Minimum | 1.4% | 7.3% |
| Maximum | 58.4% | 53.9% |
| Range | 57.0% | 46.6% |
| Mean | 14.2% | 20.9% |
| Median | 10.9% | 19.9% |
| Interquartile 25% (IQ1) | 6.8% | 16.4% |
| Interquartile 75% (IQ3) | 17.4% | 24.4% |
| Interquartile Range (IQR) | 10.6% | 8.0% |
| Standard Deviation (Sample) | 11.6% | 8.3% |
| Standard Deviation (Population) | 11.4% | 8.2% |
Similar Demographics by Child Poverty Under the Age of 5
Demographics Similar to Cypriots by Child Poverty Under the Age of 5
In terms of child poverty under the age of 5, the demographic groups most similar to Cypriots are Asian (14.0%, a difference of 0.0%), Bulgarian (13.9%, a difference of 0.52%), Immigrants from Lithuania (14.1%, a difference of 0.93%), Immigrants from Bolivia (13.8%, a difference of 0.96%), and Bolivian (13.8%, a difference of 1.0%).
| Demographics | Rating | Rank | Child Poverty Under the Age of 5 |
| Immigrants | China | 100.0 /100 | #18 | Exceptional 13.6% |
| Immigrants | Ireland | 100.0 /100 | #19 | Exceptional 13.7% |
| Immigrants | Japan | 100.0 /100 | #20 | Exceptional 13.8% |
| Bolivians | 100.0 /100 | #21 | Exceptional 13.8% |
| Immigrants | Bolivia | 100.0 /100 | #22 | Exceptional 13.8% |
| Bulgarians | 99.9 /100 | #23 | Exceptional 13.9% |
| Asians | 99.9 /100 | #24 | Exceptional 14.0% |
| Cypriots | 99.9 /100 | #25 | Exceptional 14.0% |
| Immigrants | Lithuania | 99.9 /100 | #26 | Exceptional 14.1% |
| Tongans | 99.9 /100 | #27 | Exceptional 14.2% |
| Immigrants | Indonesia | 99.8 /100 | #28 | Exceptional 14.3% |
| Immigrants | Asia | 99.8 /100 | #29 | Exceptional 14.4% |
| Cambodians | 99.8 /100 | #30 | Exceptional 14.4% |
| Koreans | 99.8 /100 | #31 | Exceptional 14.4% |
| Immigrants | Sri Lanka | 99.8 /100 | #32 | Exceptional 14.4% |
Demographics Similar to Immigrants from Ecuador by Child Poverty Under the Age of 5
In terms of child poverty under the age of 5, the demographic groups most similar to Immigrants from Ecuador are Alaska Native (19.6%, a difference of 0.060%), Immigrants from Guyana (19.6%, a difference of 0.18%), Osage (19.6%, a difference of 0.28%), Immigrants from Ghana (19.6%, a difference of 0.30%), and Vietnamese (19.5%, a difference of 0.37%).
| Demographics | Rating | Rank | Child Poverty Under the Age of 5 |
| Sudanese | 0.9 /100 | #233 | Tragic 19.3% |
| Immigrants | Micronesia | 0.9 /100 | #234 | Tragic 19.4% |
| Immigrants | Laos | 0.8 /100 | #235 | Tragic 19.4% |
| Immigrants | Trinidad and Tobago | 0.8 /100 | #236 | Tragic 19.4% |
| Immigrants | Cabo Verde | 0.6 /100 | #237 | Tragic 19.5% |
| Salvadorans | 0.6 /100 | #238 | Tragic 19.5% |
| Vietnamese | 0.6 /100 | #239 | Tragic 19.5% |
| Immigrants | Ecuador | 0.5 /100 | #240 | Tragic 19.6% |
| Alaska Natives | 0.5 /100 | #241 | Tragic 19.6% |
| Immigrants | Guyana | 0.5 /100 | #242 | Tragic 19.6% |
| Osage | 0.5 /100 | #243 | Tragic 19.6% |
| Immigrants | Ghana | 0.5 /100 | #244 | Tragic 19.6% |
| Immigrants | Western Africa | 0.4 /100 | #245 | Tragic 19.7% |
| Cree | 0.4 /100 | #246 | Tragic 19.7% |
| Guyanese | 0.4 /100 | #247 | Tragic 19.7% |