Tongan vs Immigrants from Ecuador Divorced or Separated
COMPARE
Tongan
Immigrants from Ecuador
Divorced or Separated
Divorced or Separated Comparison
Tongans
Immigrants from Ecuador
11.1%
DIVORCED OR SEPARATED
100.0/ 100
METRIC RATING
32nd/ 347
METRIC RANK
11.8%
DIVORCED OR SEPARATED
88.9/ 100
METRIC RATING
128th/ 347
METRIC RANK
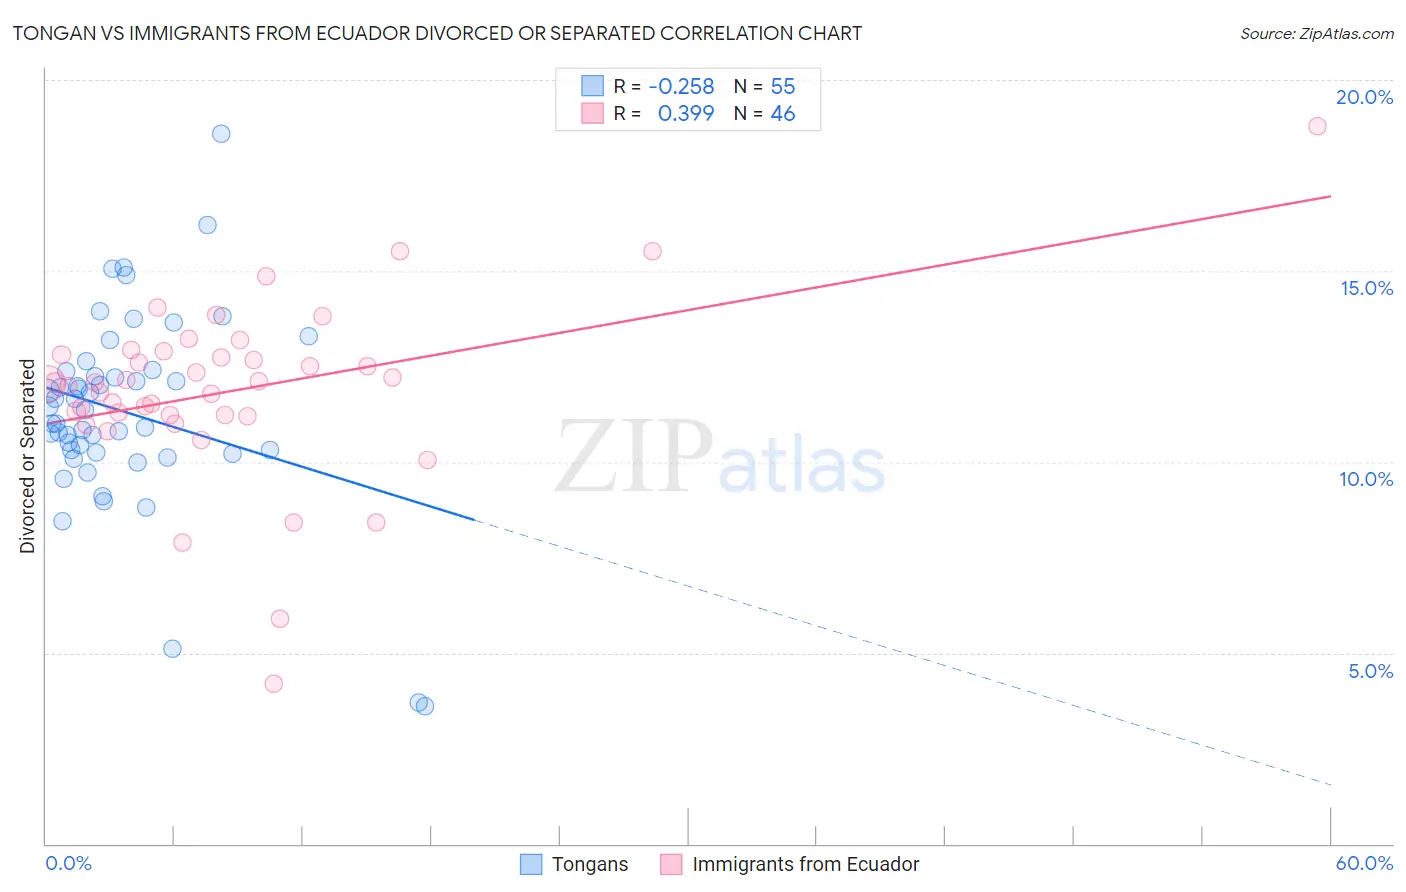
Tongan vs Immigrants from Ecuador Divorced or Separated Correlation Chart
The statistical analysis conducted on geographies consisting of 102,897,047 people shows a weak negative correlation between the proportion of Tongans and percentage of population currently divorced or separated in the United States with a correlation coefficient (R) of -0.258 and weighted average of 11.1%. Similarly, the statistical analysis conducted on geographies consisting of 270,954,904 people shows a mild positive correlation between the proportion of Immigrants from Ecuador and percentage of population currently divorced or separated in the United States with a correlation coefficient (R) of 0.399 and weighted average of 11.8%, a difference of 6.9%.
Divorced or Separated Correlation Summary
| Measurement | Tongan | Immigrants from Ecuador |
| Minimum | 3.6% | 4.2% |
| Maximum | 18.6% | 18.8% |
| Range | 15.0% | 14.6% |
| Mean | 11.3% | 11.9% |
| Median | 11.4% | 12.0% |
| Interquartile 25% (IQ1) | 10.2% | 11.2% |
| Interquartile 75% (IQ3) | 12.4% | 12.8% |
| Interquartile Range (IQR) | 2.1% | 1.6% |
| Standard Deviation (Sample) | 2.6% | 2.4% |
| Standard Deviation (Population) | 2.6% | 2.3% |
Similar Demographics by Divorced or Separated
Demographics Similar to Tongans by Divorced or Separated
In terms of divorced or separated, the demographic groups most similar to Tongans are Egyptian (11.1%, a difference of 0.040%), Mongolian (11.1%, a difference of 0.080%), Immigrants from Uzbekistan (11.1%, a difference of 0.12%), Cambodian (11.1%, a difference of 0.20%), and Immigrants from Japan (11.1%, a difference of 0.25%).
| Demographics | Rating | Rank | Divorced or Separated |
| Iranians | 100.0 /100 | #25 | Exceptional 10.8% |
| Immigrants | Indonesia | 100.0 /100 | #26 | Exceptional 10.9% |
| Immigrants | Bangladesh | 100.0 /100 | #27 | Exceptional 11.0% |
| Immigrants | Malaysia | 100.0 /100 | #28 | Exceptional 11.0% |
| Armenians | 100.0 /100 | #29 | Exceptional 11.0% |
| Immigrants | Ireland | 100.0 /100 | #30 | Exceptional 11.0% |
| Mongolians | 100.0 /100 | #31 | Exceptional 11.1% |
| Tongans | 100.0 /100 | #32 | Exceptional 11.1% |
| Egyptians | 100.0 /100 | #33 | Exceptional 11.1% |
| Immigrants | Uzbekistan | 100.0 /100 | #34 | Exceptional 11.1% |
| Cambodians | 100.0 /100 | #35 | Exceptional 11.1% |
| Immigrants | Japan | 100.0 /100 | #36 | Exceptional 11.1% |
| Immigrants | Lebanon | 100.0 /100 | #37 | Exceptional 11.1% |
| Immigrants | Greece | 100.0 /100 | #38 | Exceptional 11.1% |
| Immigrants | Egypt | 100.0 /100 | #39 | Exceptional 11.1% |
Demographics Similar to Immigrants from Ecuador by Divorced or Separated
In terms of divorced or separated, the demographic groups most similar to Immigrants from Ecuador are South African (11.8%, a difference of 0.0%), Immigrants from St. Vincent and the Grenadines (11.8%, a difference of 0.040%), Immigrants from Austria (11.8%, a difference of 0.050%), Immigrants from Cambodia (11.8%, a difference of 0.060%), and Immigrants from Afghanistan (11.8%, a difference of 0.080%).
| Demographics | Rating | Rank | Divorced or Separated |
| Romanians | 94.5 /100 | #121 | Exceptional 11.8% |
| Menominee | 93.8 /100 | #122 | Exceptional 11.8% |
| Immigrants | Immigrants | 93.7 /100 | #123 | Exceptional 11.8% |
| Ugandans | 93.1 /100 | #124 | Exceptional 11.8% |
| Ukrainians | 92.3 /100 | #125 | Exceptional 11.8% |
| South American Indians | 92.1 /100 | #126 | Exceptional 11.8% |
| South Africans | 88.9 /100 | #127 | Excellent 11.8% |
| Immigrants | Ecuador | 88.9 /100 | #128 | Excellent 11.8% |
| Immigrants | St. Vincent and the Grenadines | 88.4 /100 | #129 | Excellent 11.8% |
| Immigrants | Austria | 88.2 /100 | #130 | Excellent 11.8% |
| Immigrants | Cambodia | 88.2 /100 | #131 | Excellent 11.8% |
| Immigrants | Afghanistan | 87.9 /100 | #132 | Excellent 11.8% |
| New Zealanders | 87.5 /100 | #133 | Excellent 11.9% |
| Argentineans | 85.1 /100 | #134 | Excellent 11.9% |
| Danes | 84.8 /100 | #135 | Excellent 11.9% |