Cypriot vs Immigrants from Portugal Average Family Size
COMPARE
Cypriot
Immigrants from Portugal
Average Family Size
Average Family Size Comparison
Cypriots
Immigrants from Portugal
3.14
AVERAGE FAMILY SIZE
0.3/ 100
METRIC RATING
290th/ 347
METRIC RANK
3.18
AVERAGE FAMILY SIZE
4.2/ 100
METRIC RATING
236th/ 347
METRIC RANK
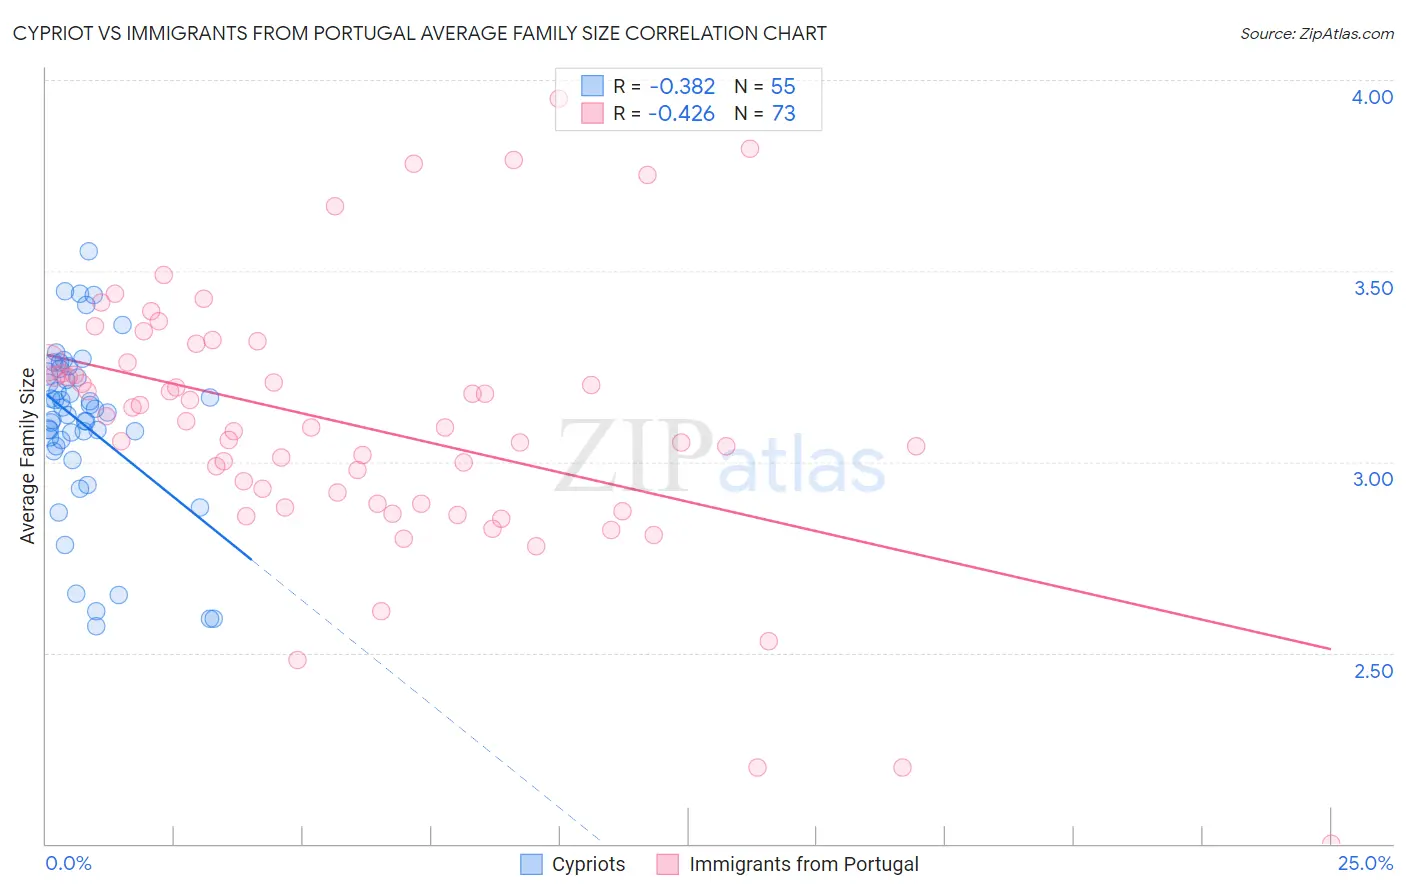
Cypriot vs Immigrants from Portugal Average Family Size Correlation Chart
The statistical analysis conducted on geographies consisting of 61,854,678 people shows a mild negative correlation between the proportion of Cypriots and average family size in the United States with a correlation coefficient (R) of -0.382 and weighted average of 3.14. Similarly, the statistical analysis conducted on geographies consisting of 174,766,763 people shows a moderate negative correlation between the proportion of Immigrants from Portugal and average family size in the United States with a correlation coefficient (R) of -0.426 and weighted average of 3.18, a difference of 1.3%.
Average Family Size Correlation Summary
| Measurement | Cypriot | Immigrants from Portugal |
| Minimum | 2.57 | 2.00 |
| Maximum | 3.55 | 3.95 |
| Range | 0.98 | 1.95 |
| Mean | 3.10 | 3.10 |
| Median | 3.13 | 3.09 |
| Interquartile 25% (IQ1) | 3.04 | 2.89 |
| Interquartile 75% (IQ3) | 3.23 | 3.26 |
| Interquartile Range (IQR) | 0.19 | 0.37 |
| Standard Deviation (Sample) | 0.22 | 0.35 |
| Standard Deviation (Population) | 0.22 | 0.35 |
Similar Demographics by Average Family Size
Demographics Similar to Cypriots by Average Family Size
In terms of average family size, the demographic groups most similar to Cypriots are Greek (3.14, a difference of 0.030%), Immigrants from Czechoslovakia (3.14, a difference of 0.030%), Immigrants from Norway (3.14, a difference of 0.030%), Immigrants from Netherlands (3.14, a difference of 0.040%), and Alsatian (3.14, a difference of 0.040%).
| Demographics | Rating | Rank | Average Family Size |
| German Russians | 0.4 /100 | #283 | Tragic 3.15 |
| Immigrants | France | 0.4 /100 | #284 | Tragic 3.15 |
| Whites/Caucasians | 0.3 /100 | #285 | Tragic 3.14 |
| Immigrants | Netherlands | 0.3 /100 | #286 | Tragic 3.14 |
| Greeks | 0.3 /100 | #287 | Tragic 3.14 |
| Immigrants | Czechoslovakia | 0.3 /100 | #288 | Tragic 3.14 |
| Immigrants | Norway | 0.3 /100 | #289 | Tragic 3.14 |
| Cypriots | 0.3 /100 | #290 | Tragic 3.14 |
| Alsatians | 0.2 /100 | #291 | Tragic 3.14 |
| Europeans | 0.2 /100 | #292 | Tragic 3.14 |
| Scandinavians | 0.2 /100 | #293 | Tragic 3.14 |
| Immigrants | Croatia | 0.2 /100 | #294 | Tragic 3.14 |
| Austrians | 0.2 /100 | #295 | Tragic 3.14 |
| Ukrainians | 0.2 /100 | #296 | Tragic 3.14 |
| Immigrants | Western Europe | 0.2 /100 | #297 | Tragic 3.14 |
Demographics Similar to Immigrants from Portugal by Average Family Size
In terms of average family size, the demographic groups most similar to Immigrants from Portugal are Immigrants from Turkey (3.18, a difference of 0.010%), Iranian (3.18, a difference of 0.030%), Brazilian (3.18, a difference of 0.040%), Immigrants from Romania (3.18, a difference of 0.050%), and Romanian (3.18, a difference of 0.050%).
| Demographics | Rating | Rank | Average Family Size |
| Immigrants | Italy | 5.3 /100 | #229 | Tragic 3.19 |
| Icelanders | 5.2 /100 | #230 | Tragic 3.19 |
| Basques | 5.2 /100 | #231 | Tragic 3.19 |
| Cherokee | 4.7 /100 | #232 | Tragic 3.18 |
| Brazilians | 4.5 /100 | #233 | Tragic 3.18 |
| Iranians | 4.5 /100 | #234 | Tragic 3.18 |
| Immigrants | Turkey | 4.2 /100 | #235 | Tragic 3.18 |
| Immigrants | Portugal | 4.2 /100 | #236 | Tragic 3.18 |
| Immigrants | Romania | 3.7 /100 | #237 | Tragic 3.18 |
| Romanians | 3.7 /100 | #238 | Tragic 3.18 |
| Houma | 3.4 /100 | #239 | Tragic 3.18 |
| Osage | 3.2 /100 | #240 | Tragic 3.18 |
| Immigrants | Japan | 3.0 /100 | #241 | Tragic 3.18 |
| Hungarians | 3.0 /100 | #242 | Tragic 3.18 |
| Immigrants | Moldova | 2.9 /100 | #243 | Tragic 3.18 |