Cypriot vs Immigrants from Belarus Births to Unmarried Women
COMPARE
Cypriot
Immigrants from Belarus
Births to Unmarried Women
Births to Unmarried Women Comparison
Cypriots
Immigrants from Belarus
27.0%
BIRTHS TO UNMARRIED WOMEN
99.8/ 100
METRIC RATING
29th/ 347
METRIC RANK
25.6%
BIRTHS TO UNMARRIED WOMEN
100.0/ 100
METRIC RATING
16th/ 347
METRIC RANK
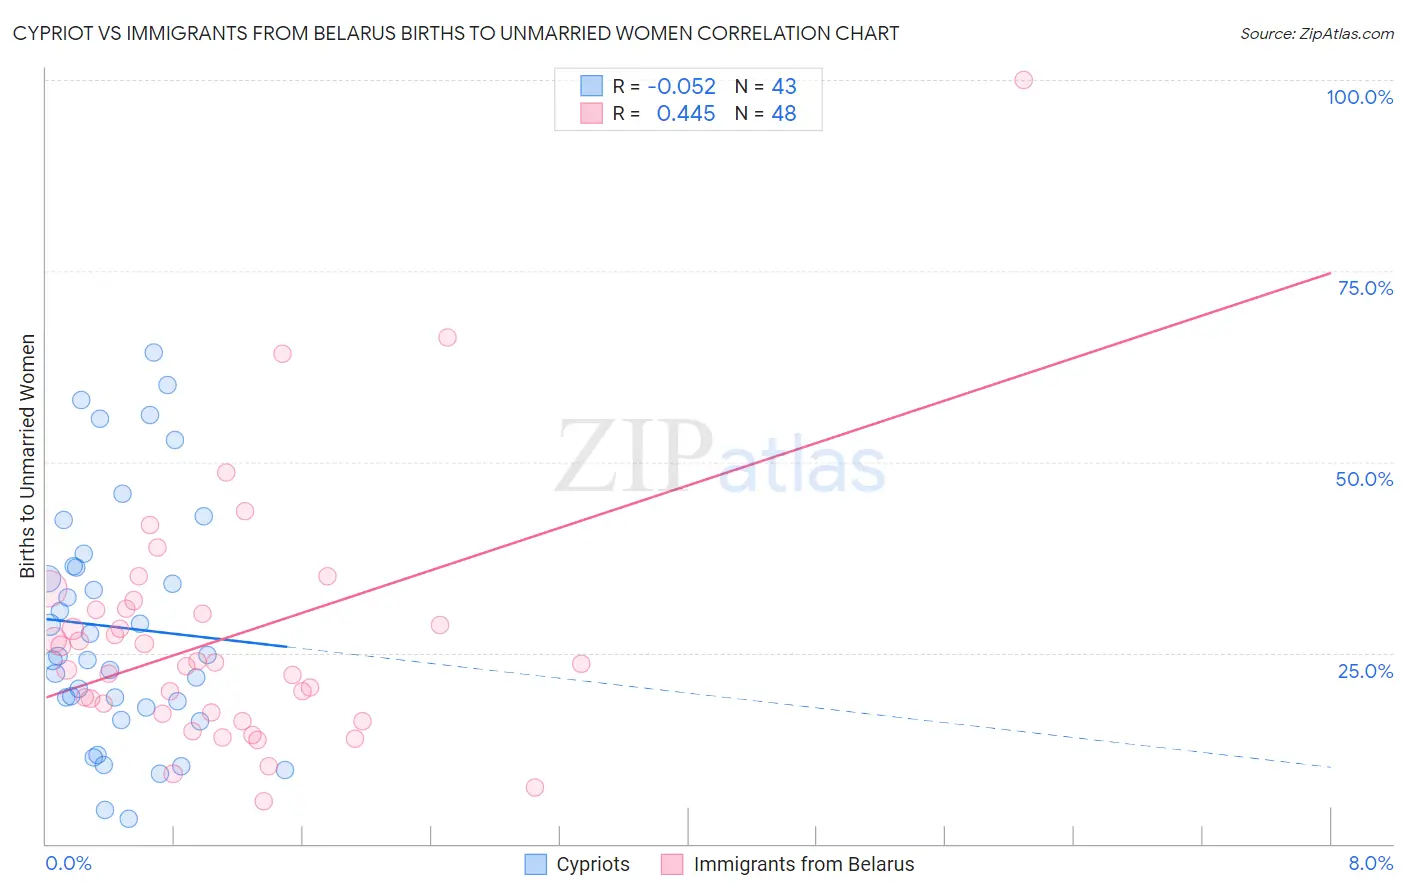
Cypriot vs Immigrants from Belarus Births to Unmarried Women Correlation Chart
The statistical analysis conducted on geographies consisting of 59,994,740 people shows a slight negative correlation between the proportion of Cypriots and percentage of births to unmarried women in the United States with a correlation coefficient (R) of -0.052 and weighted average of 27.0%. Similarly, the statistical analysis conducted on geographies consisting of 142,991,373 people shows a moderate positive correlation between the proportion of Immigrants from Belarus and percentage of births to unmarried women in the United States with a correlation coefficient (R) of 0.445 and weighted average of 25.6%, a difference of 5.4%.
Births to Unmarried Women Correlation Summary
| Measurement | Cypriot | Immigrants from Belarus |
| Minimum | 3.3% | 5.6% |
| Maximum | 64.3% | 100.0% |
| Range | 61.0% | 94.4% |
| Mean | 28.3% | 27.0% |
| Median | 24.6% | 23.7% |
| Interquartile 25% (IQ1) | 17.9% | 17.1% |
| Interquartile 75% (IQ3) | 36.3% | 30.7% |
| Interquartile Range (IQR) | 18.4% | 13.5% |
| Standard Deviation (Sample) | 15.8% | 16.5% |
| Standard Deviation (Population) | 15.6% | 16.3% |
Demographics Similar to Cypriots and Immigrants from Belarus by Births to Unmarried Women
In terms of births to unmarried women, the demographic groups most similar to Cypriots are Bulgarian (27.1%, a difference of 0.16%), Okinawan (26.9%, a difference of 0.36%), Immigrants from Iraq (27.1%, a difference of 0.45%), Immigrants from Russia (27.1%, a difference of 0.48%), and Immigrants from Asia (26.8%, a difference of 0.87%). Similarly, the demographic groups most similar to Immigrants from Belarus are Immigrants from Singapore (25.6%, a difference of 0.050%), Immigrants from Uzbekistan (25.8%, a difference of 0.57%), Immigrants from Lebanon (25.3%, a difference of 1.2%), Iranian (25.3%, a difference of 1.3%), and Indian (Asian) (25.3%, a difference of 1.5%).
| Demographics | Rating | Rank | Births to Unmarried Women |
| Indians (Asian) | 100.0 /100 | #12 | Exceptional 25.3% |
| Iranians | 100.0 /100 | #13 | Exceptional 25.3% |
| Immigrants | Lebanon | 100.0 /100 | #14 | Exceptional 25.3% |
| Immigrants | Singapore | 100.0 /100 | #15 | Exceptional 25.6% |
| Immigrants | Belarus | 100.0 /100 | #16 | Exceptional 25.6% |
| Immigrants | Uzbekistan | 100.0 /100 | #17 | Exceptional 25.8% |
| Immigrants | Armenia | 99.9 /100 | #18 | Exceptional 26.1% |
| Armenians | 99.9 /100 | #19 | Exceptional 26.2% |
| Immigrants | Korea | 99.9 /100 | #20 | Exceptional 26.3% |
| Soviet Union | 99.9 /100 | #21 | Exceptional 26.3% |
| Burmese | 99.9 /100 | #22 | Exceptional 26.4% |
| Immigrants | Japan | 99.9 /100 | #23 | Exceptional 26.4% |
| Immigrants | Australia | 99.9 /100 | #24 | Exceptional 26.6% |
| Cambodians | 99.9 /100 | #25 | Exceptional 26.7% |
| Asians | 99.9 /100 | #26 | Exceptional 26.8% |
| Immigrants | Asia | 99.9 /100 | #27 | Exceptional 26.8% |
| Okinawans | 99.8 /100 | #28 | Exceptional 26.9% |
| Cypriots | 99.8 /100 | #29 | Exceptional 27.0% |
| Bulgarians | 99.8 /100 | #30 | Exceptional 27.1% |
| Immigrants | Iraq | 99.8 /100 | #31 | Exceptional 27.1% |
| Immigrants | Russia | 99.8 /100 | #32 | Exceptional 27.1% |