Cypriot vs Immigrants from Russia Average Family Size
COMPARE
Cypriot
Immigrants from Russia
Average Family Size
Average Family Size Comparison
Cypriots
Immigrants from Russia
3.14
AVERAGE FAMILY SIZE
0.3/ 100
METRIC RATING
290th/ 347
METRIC RANK
3.16
AVERAGE FAMILY SIZE
1.3/ 100
METRIC RATING
262nd/ 347
METRIC RANK
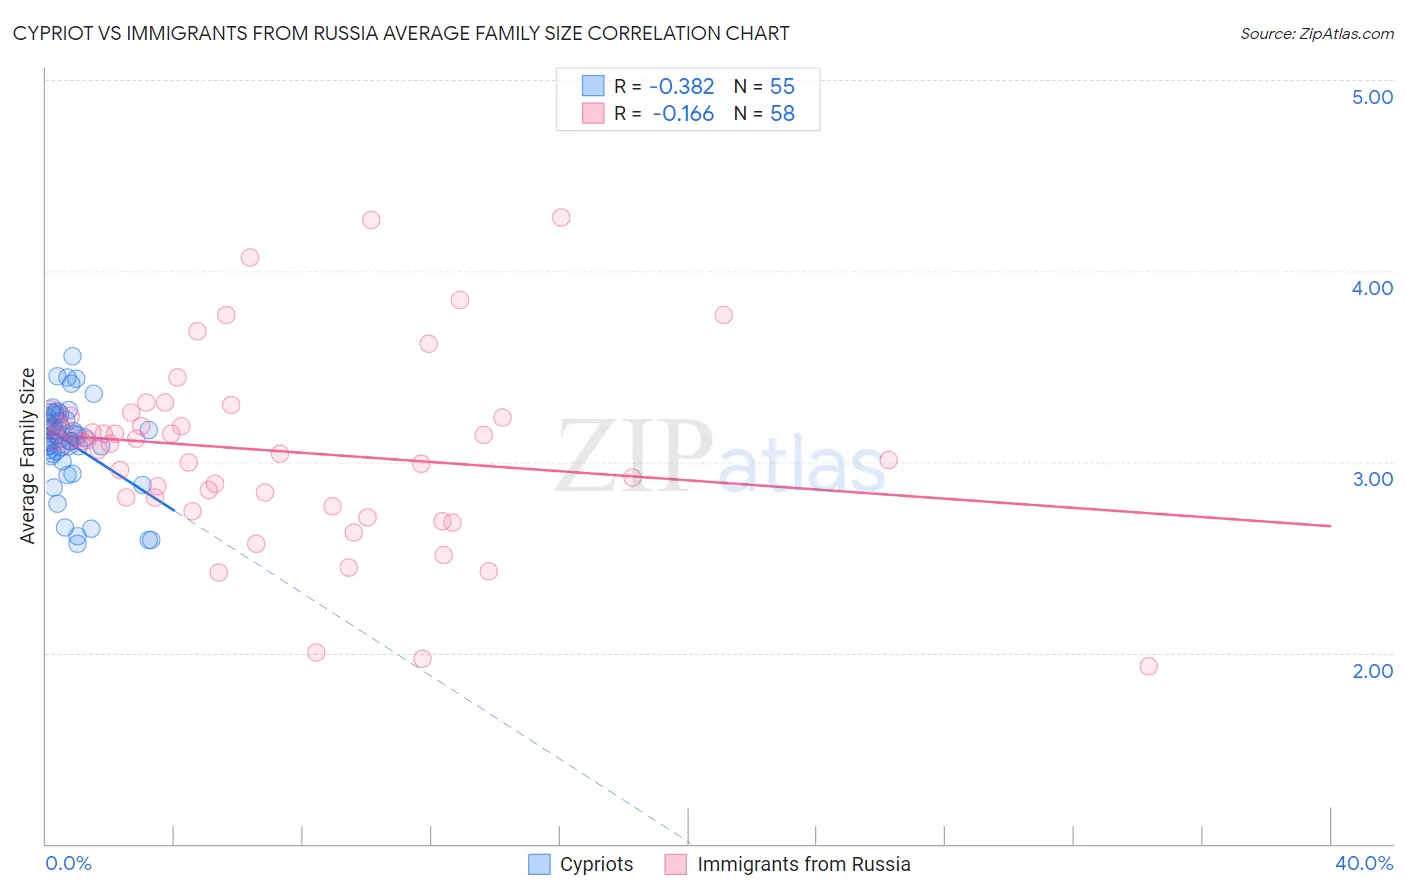
Cypriot vs Immigrants from Russia Average Family Size Correlation Chart
The statistical analysis conducted on geographies consisting of 61,854,678 people shows a mild negative correlation between the proportion of Cypriots and average family size in the United States with a correlation coefficient (R) of -0.382 and weighted average of 3.14. Similarly, the statistical analysis conducted on geographies consisting of 347,722,348 people shows a poor negative correlation between the proportion of Immigrants from Russia and average family size in the United States with a correlation coefficient (R) of -0.166 and weighted average of 3.16, a difference of 0.73%.
Average Family Size Correlation Summary
| Measurement | Cypriot | Immigrants from Russia |
| Minimum | 2.57 | 1.93 |
| Maximum | 3.55 | 4.28 |
| Range | 0.98 | 2.35 |
| Mean | 3.10 | 3.06 |
| Median | 3.13 | 3.10 |
| Interquartile 25% (IQ1) | 3.04 | 2.81 |
| Interquartile 75% (IQ3) | 3.23 | 3.23 |
| Interquartile Range (IQR) | 0.19 | 0.42 |
| Standard Deviation (Sample) | 0.22 | 0.48 |
| Standard Deviation (Population) | 0.22 | 0.48 |
Similar Demographics by Average Family Size
Demographics Similar to Cypriots by Average Family Size
In terms of average family size, the demographic groups most similar to Cypriots are Greek (3.14, a difference of 0.030%), Immigrants from Czechoslovakia (3.14, a difference of 0.030%), Immigrants from Norway (3.14, a difference of 0.030%), Immigrants from Netherlands (3.14, a difference of 0.040%), and Alsatian (3.14, a difference of 0.040%).
| Demographics | Rating | Rank | Average Family Size |
| German Russians | 0.4 /100 | #283 | Tragic 3.15 |
| Immigrants | France | 0.4 /100 | #284 | Tragic 3.15 |
| Whites/Caucasians | 0.3 /100 | #285 | Tragic 3.14 |
| Immigrants | Netherlands | 0.3 /100 | #286 | Tragic 3.14 |
| Greeks | 0.3 /100 | #287 | Tragic 3.14 |
| Immigrants | Czechoslovakia | 0.3 /100 | #288 | Tragic 3.14 |
| Immigrants | Norway | 0.3 /100 | #289 | Tragic 3.14 |
| Cypriots | 0.3 /100 | #290 | Tragic 3.14 |
| Alsatians | 0.2 /100 | #291 | Tragic 3.14 |
| Europeans | 0.2 /100 | #292 | Tragic 3.14 |
| Scandinavians | 0.2 /100 | #293 | Tragic 3.14 |
| Immigrants | Croatia | 0.2 /100 | #294 | Tragic 3.14 |
| Austrians | 0.2 /100 | #295 | Tragic 3.14 |
| Ukrainians | 0.2 /100 | #296 | Tragic 3.14 |
| Immigrants | Western Europe | 0.2 /100 | #297 | Tragic 3.14 |
Demographics Similar to Immigrants from Russia by Average Family Size
In terms of average family size, the demographic groups most similar to Immigrants from Russia are Immigrants from Albania (3.16, a difference of 0.010%), Immigrants from North Macedonia (3.16, a difference of 0.010%), Turkish (3.16, a difference of 0.020%), Potawatomi (3.16, a difference of 0.020%), and Albanian (3.17, a difference of 0.070%).
| Demographics | Rating | Rank | Average Family Size |
| Cape Verdeans | 1.6 /100 | #255 | Tragic 3.17 |
| Immigrants | Kazakhstan | 1.5 /100 | #256 | Tragic 3.17 |
| Albanians | 1.5 /100 | #257 | Tragic 3.17 |
| Turks | 1.3 /100 | #258 | Tragic 3.16 |
| Potawatomi | 1.3 /100 | #259 | Tragic 3.16 |
| Immigrants | Albania | 1.3 /100 | #260 | Tragic 3.16 |
| Immigrants | North Macedonia | 1.3 /100 | #261 | Tragic 3.16 |
| Immigrants | Russia | 1.3 /100 | #262 | Tragic 3.16 |
| Immigrants | Bulgaria | 1.0 /100 | #263 | Tragic 3.16 |
| Americans | 1.0 /100 | #264 | Tragic 3.16 |
| Immigrants | South Africa | 0.9 /100 | #265 | Tragic 3.16 |
| Immigrants | Greece | 0.9 /100 | #266 | Tragic 3.16 |
| Iroquois | 0.8 /100 | #267 | Tragic 3.16 |
| Maltese | 0.8 /100 | #268 | Tragic 3.16 |
| Immigrants | Singapore | 0.7 /100 | #269 | Tragic 3.16 |