Crow vs Immigrants from Ireland Married-couple Households
COMPARE
Crow
Immigrants from Ireland
Married-couple Households
Married-couple Households Comparison
Crow
Immigrants from Ireland
41.4%
MARRIED-COUPLE HOUSEHOLDS
0.0/ 100
METRIC RATING
308th/ 347
METRIC RANK
48.0%
MARRIED-COUPLE HOUSEHOLDS
97.3/ 100
METRIC RATING
87th/ 347
METRIC RANK
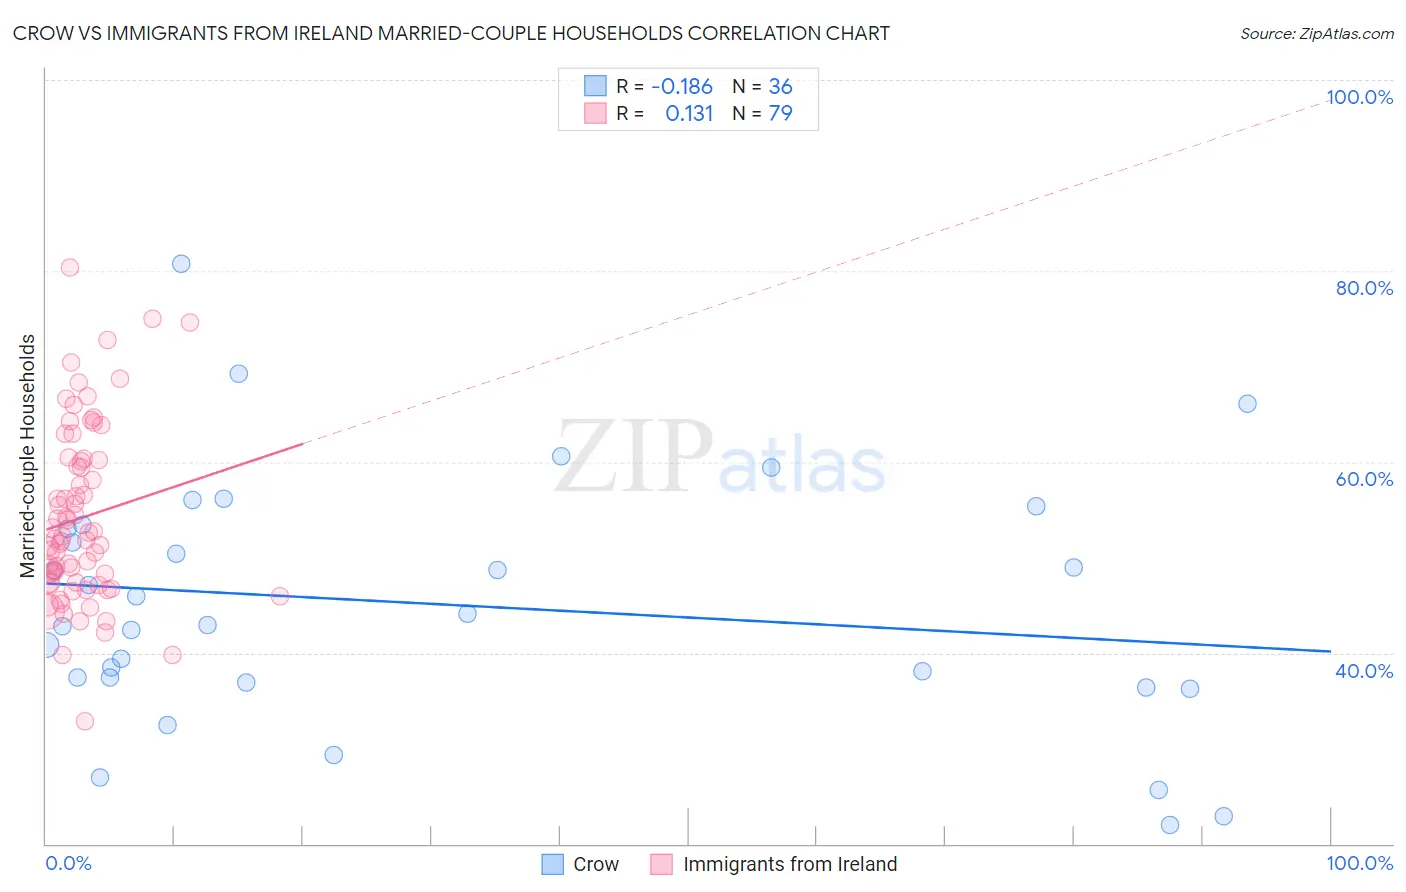
Crow vs Immigrants from Ireland Married-couple Households Correlation Chart
The statistical analysis conducted on geographies consisting of 59,202,817 people shows a poor negative correlation between the proportion of Crow and percentage of married-couple family households in the United States with a correlation coefficient (R) of -0.186 and weighted average of 41.4%. Similarly, the statistical analysis conducted on geographies consisting of 240,743,344 people shows a poor positive correlation between the proportion of Immigrants from Ireland and percentage of married-couple family households in the United States with a correlation coefficient (R) of 0.131 and weighted average of 48.0%, a difference of 16.1%.
Married-couple Households Correlation Summary
| Measurement | Crow | Immigrants from Ireland |
| Minimum | 21.9% | 32.8% |
| Maximum | 80.8% | 80.3% |
| Range | 58.9% | 47.5% |
| Mean | 45.1% | 54.1% |
| Median | 43.5% | 51.9% |
| Interquartile 25% (IQ1) | 37.1% | 47.4% |
| Interquartile 75% (IQ3) | 53.2% | 60.2% |
| Interquartile Range (IQR) | 16.0% | 12.8% |
| Standard Deviation (Sample) | 13.1% | 9.2% |
| Standard Deviation (Population) | 12.9% | 9.1% |
Similar Demographics by Married-couple Households
Demographics Similar to Crow by Married-couple Households
In terms of married-couple households, the demographic groups most similar to Crow are Guyanese (41.4%, a difference of 0.010%), Immigrants from Western Africa (41.4%, a difference of 0.010%), Immigrants from Trinidad and Tobago (41.2%, a difference of 0.35%), Sioux (41.5%, a difference of 0.38%), and Haitian (41.2%, a difference of 0.42%).
| Demographics | Rating | Rank | Married-couple Households |
| Immigrants | Bahamas | 0.0 /100 | #301 | Tragic 41.7% |
| Immigrants | Honduras | 0.0 /100 | #302 | Tragic 41.6% |
| Sub-Saharan Africans | 0.0 /100 | #303 | Tragic 41.6% |
| Immigrants | Guyana | 0.0 /100 | #304 | Tragic 41.6% |
| Sioux | 0.0 /100 | #305 | Tragic 41.5% |
| Guyanese | 0.0 /100 | #306 | Tragic 41.4% |
| Immigrants | Western Africa | 0.0 /100 | #307 | Tragic 41.4% |
| Crow | 0.0 /100 | #308 | Tragic 41.4% |
| Immigrants | Trinidad and Tobago | 0.0 /100 | #309 | Tragic 41.2% |
| Haitians | 0.0 /100 | #310 | Tragic 41.2% |
| Colville | 0.0 /100 | #311 | Tragic 41.0% |
| Africans | 0.0 /100 | #312 | Tragic 40.9% |
| Immigrants | Haiti | 0.0 /100 | #313 | Tragic 40.9% |
| Jamaicans | 0.0 /100 | #314 | Tragic 40.9% |
| Trinidadians and Tobagonians | 0.0 /100 | #315 | Tragic 40.9% |
Demographics Similar to Immigrants from Ireland by Married-couple Households
In terms of married-couple households, the demographic groups most similar to Immigrants from Ireland are Afghan (48.0%, a difference of 0.0%), Belgian (48.0%, a difference of 0.010%), Cypriot (48.0%, a difference of 0.030%), Immigrants from Israel (48.0%, a difference of 0.040%), and French (48.0%, a difference of 0.050%).
| Demographics | Rating | Rank | Married-couple Households |
| Russians | 98.1 /100 | #80 | Exceptional 48.2% |
| Finns | 98.0 /100 | #81 | Exceptional 48.1% |
| Immigrants | Poland | 97.7 /100 | #82 | Exceptional 48.1% |
| Guamanians/Chamorros | 97.6 /100 | #83 | Exceptional 48.1% |
| Ukrainians | 97.6 /100 | #84 | Exceptional 48.1% |
| Immigrants | Israel | 97.4 /100 | #85 | Exceptional 48.0% |
| Belgians | 97.4 /100 | #86 | Exceptional 48.0% |
| Immigrants | Ireland | 97.3 /100 | #87 | Exceptional 48.0% |
| Afghans | 97.3 /100 | #88 | Exceptional 48.0% |
| Cypriots | 97.2 /100 | #89 | Exceptional 48.0% |
| French | 97.2 /100 | #90 | Exceptional 48.0% |
| Immigrants | Moldova | 97.0 /100 | #91 | Exceptional 48.0% |
| Palestinians | 96.9 /100 | #92 | Exceptional 48.0% |
| Lebanese | 96.9 /100 | #93 | Exceptional 47.9% |
| Americans | 96.9 /100 | #94 | Exceptional 47.9% |