Croatian vs Greek Divorced or Separated
COMPARE
Croatian
Greek
Divorced or Separated
Divorced or Separated Comparison
Croatians
Greeks
11.9%
DIVORCED OR SEPARATED
80.6/ 100
METRIC RATING
145th/ 347
METRIC RANK
11.7%
DIVORCED OR SEPARATED
96.9/ 100
METRIC RATING
108th/ 347
METRIC RANK
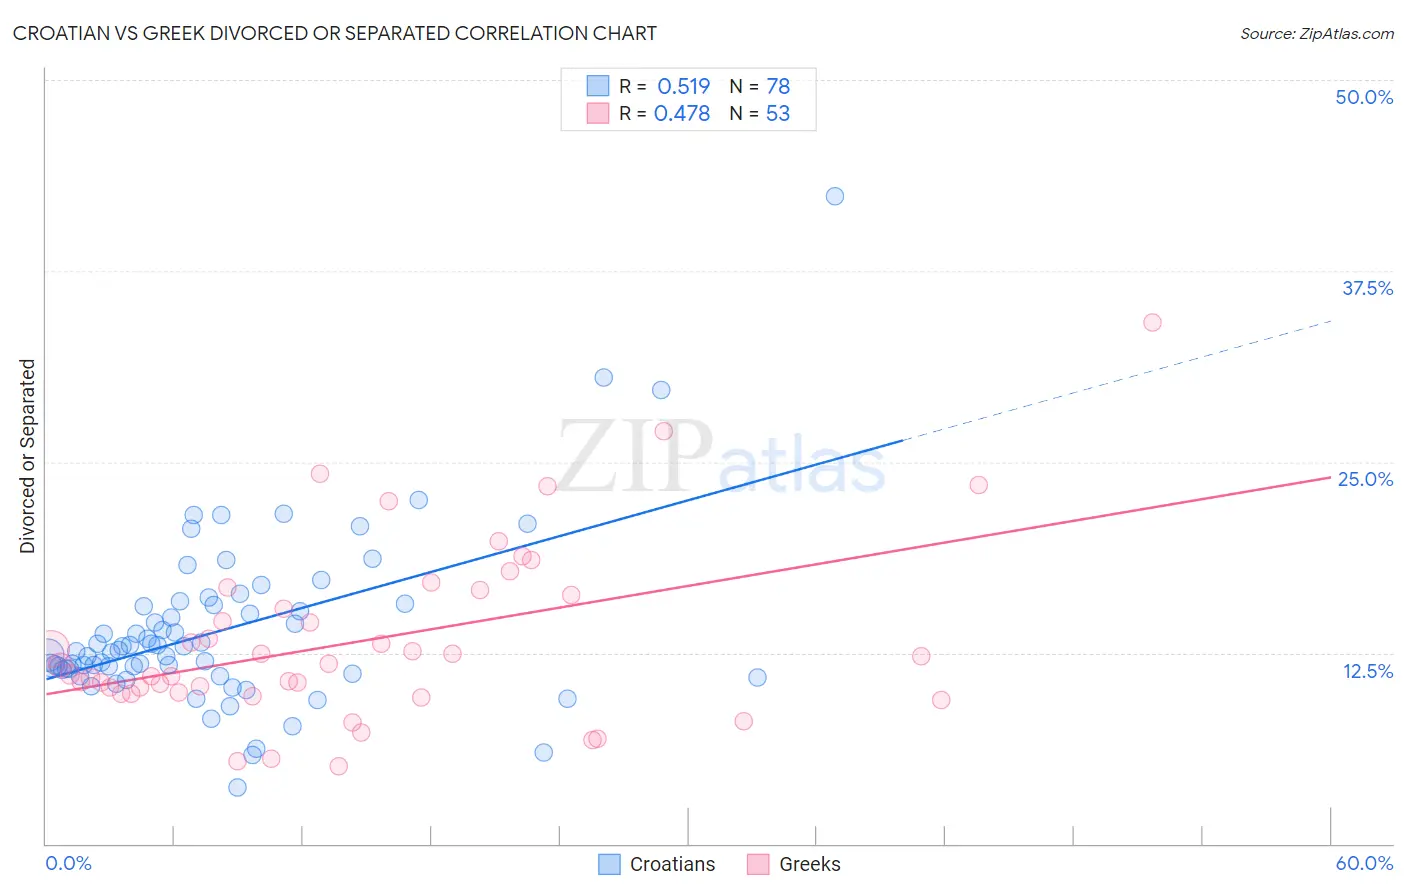
Croatian vs Greek Divorced or Separated Correlation Chart
The statistical analysis conducted on geographies consisting of 375,586,631 people shows a substantial positive correlation between the proportion of Croatians and percentage of population currently divorced or separated in the United States with a correlation coefficient (R) of 0.519 and weighted average of 11.9%. Similarly, the statistical analysis conducted on geographies consisting of 482,480,692 people shows a moderate positive correlation between the proportion of Greeks and percentage of population currently divorced or separated in the United States with a correlation coefficient (R) of 0.478 and weighted average of 11.7%, a difference of 1.8%.
Divorced or Separated Correlation Summary
| Measurement | Croatian | Greek |
| Minimum | 3.7% | 5.1% |
| Maximum | 42.4% | 34.1% |
| Range | 38.7% | 29.0% |
| Mean | 14.0% | 13.3% |
| Median | 12.6% | 11.7% |
| Interquartile 25% (IQ1) | 11.4% | 9.9% |
| Interquartile 75% (IQ3) | 15.6% | 16.4% |
| Interquartile Range (IQR) | 4.2% | 6.6% |
| Standard Deviation (Sample) | 5.7% | 5.8% |
| Standard Deviation (Population) | 5.6% | 5.7% |
Similar Demographics by Divorced or Separated
Demographics Similar to Croatians by Divorced or Separated
In terms of divorced or separated, the demographic groups most similar to Croatians are Peruvian (11.9%, a difference of 0.020%), Immigrants from Zimbabwe (11.9%, a difference of 0.050%), Pakistani (11.9%, a difference of 0.050%), Immigrants from Grenada (11.9%, a difference of 0.080%), and Polish (11.9%, a difference of 0.11%).
| Demographics | Rating | Rank | Divorced or Separated |
| Immigrants | Netherlands | 83.9 /100 | #138 | Excellent 11.9% |
| Australians | 83.6 /100 | #139 | Excellent 11.9% |
| Lebanese | 83.4 /100 | #140 | Excellent 11.9% |
| Immigrants | Morocco | 82.9 /100 | #141 | Excellent 11.9% |
| Immigrants | Zimbabwe | 81.5 /100 | #142 | Excellent 11.9% |
| Pakistanis | 81.3 /100 | #143 | Excellent 11.9% |
| Peruvians | 80.9 /100 | #144 | Excellent 11.9% |
| Croatians | 80.6 /100 | #145 | Excellent 11.9% |
| Immigrants | Grenada | 79.1 /100 | #146 | Good 11.9% |
| Poles | 78.6 /100 | #147 | Good 11.9% |
| Italians | 77.8 /100 | #148 | Good 11.9% |
| Immigrants | Oceania | 77.7 /100 | #149 | Good 11.9% |
| Immigrants | Portugal | 77.3 /100 | #150 | Good 11.9% |
| Czechs | 76.4 /100 | #151 | Good 11.9% |
| Immigrants | Hungary | 73.7 /100 | #152 | Good 11.9% |
Demographics Similar to Greeks by Divorced or Separated
In terms of divorced or separated, the demographic groups most similar to Greeks are Immigrants from South Africa (11.7%, a difference of 0.010%), Immigrants from Czechoslovakia (11.7%, a difference of 0.010%), Immigrants from Spain (11.7%, a difference of 0.050%), Native Hawaiian (11.7%, a difference of 0.090%), and Immigrants from France (11.7%, a difference of 0.10%).
| Demographics | Rating | Rank | Divorced or Separated |
| Immigrants | Guyana | 98.5 /100 | #101 | Exceptional 11.6% |
| Immigrants | Croatia | 98.3 /100 | #102 | Exceptional 11.6% |
| Maltese | 98.2 /100 | #103 | Exceptional 11.6% |
| Salvadorans | 98.2 /100 | #104 | Exceptional 11.6% |
| Immigrants | El Salvador | 97.9 /100 | #105 | Exceptional 11.7% |
| Immigrants | Kazakhstan | 97.8 /100 | #106 | Exceptional 11.7% |
| Native Hawaiians | 97.2 /100 | #107 | Exceptional 11.7% |
| Greeks | 96.9 /100 | #108 | Exceptional 11.7% |
| Immigrants | South Africa | 96.9 /100 | #109 | Exceptional 11.7% |
| Immigrants | Czechoslovakia | 96.9 /100 | #110 | Exceptional 11.7% |
| Immigrants | Spain | 96.8 /100 | #111 | Exceptional 11.7% |
| Immigrants | France | 96.6 /100 | #112 | Exceptional 11.7% |
| Estonians | 96.6 /100 | #113 | Exceptional 11.7% |
| Immigrants | Norway | 95.9 /100 | #114 | Exceptional 11.7% |
| Lithuanians | 95.7 /100 | #115 | Exceptional 11.7% |