Croatian vs Delaware Divorced or Separated
COMPARE
Croatian
Delaware
Divorced or Separated
Divorced or Separated Comparison
Croatians
Delaware
11.9%
DIVORCED OR SEPARATED
80.6/ 100
METRIC RATING
145th/ 347
METRIC RANK
12.7%
DIVORCED OR SEPARATED
0.1/ 100
METRIC RATING
283rd/ 347
METRIC RANK
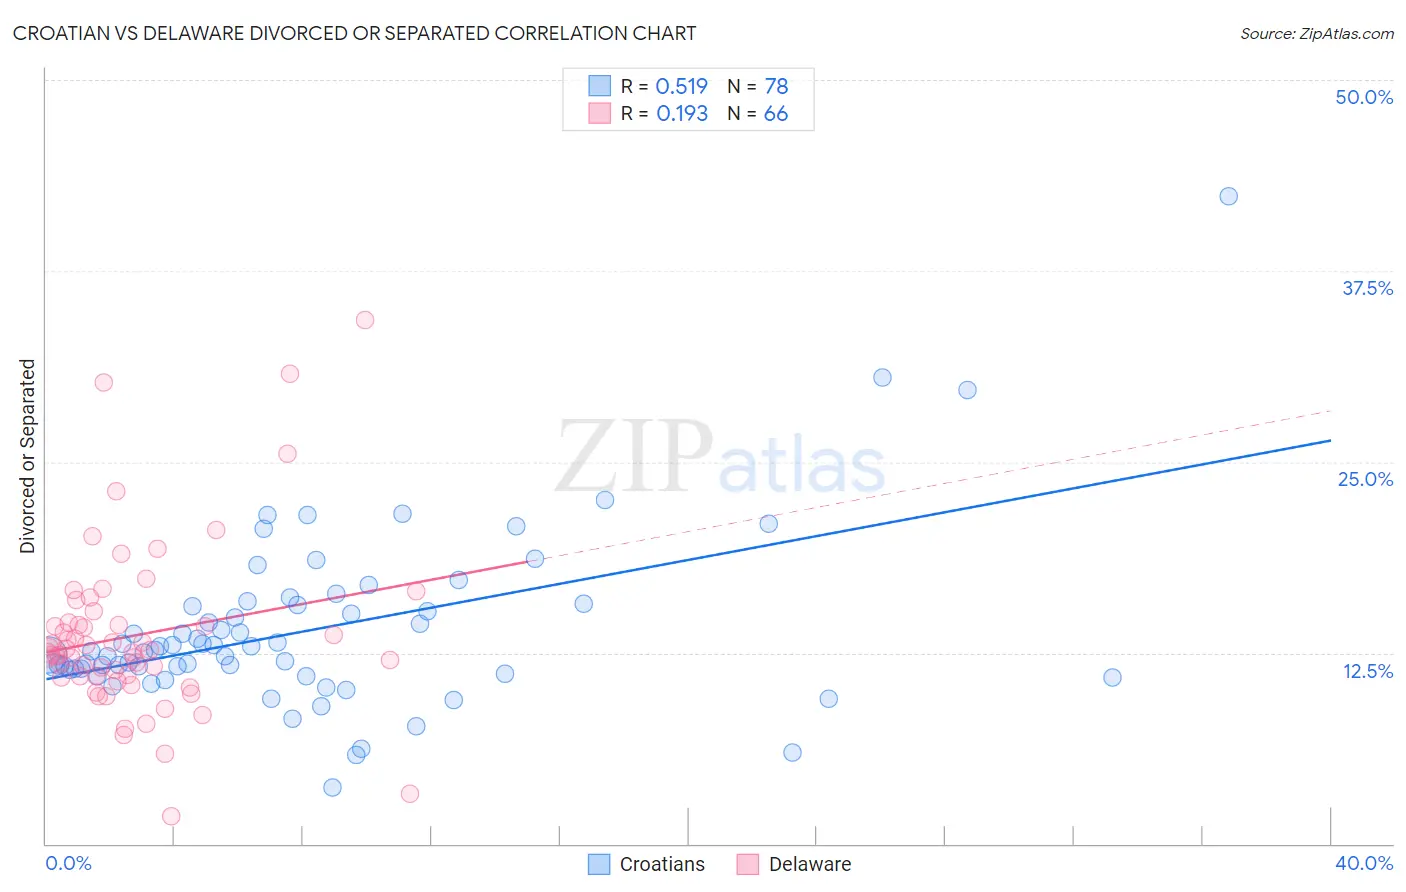
Croatian vs Delaware Divorced or Separated Correlation Chart
The statistical analysis conducted on geographies consisting of 375,586,631 people shows a substantial positive correlation between the proportion of Croatians and percentage of population currently divorced or separated in the United States with a correlation coefficient (R) of 0.519 and weighted average of 11.9%. Similarly, the statistical analysis conducted on geographies consisting of 96,237,002 people shows a poor positive correlation between the proportion of Delaware and percentage of population currently divorced or separated in the United States with a correlation coefficient (R) of 0.193 and weighted average of 12.7%, a difference of 7.0%.
Divorced or Separated Correlation Summary
| Measurement | Croatian | Delaware |
| Minimum | 3.7% | 1.8% |
| Maximum | 42.4% | 34.3% |
| Range | 38.7% | 32.5% |
| Mean | 14.0% | 13.6% |
| Median | 12.6% | 12.6% |
| Interquartile 25% (IQ1) | 11.4% | 10.9% |
| Interquartile 75% (IQ3) | 15.6% | 14.5% |
| Interquartile Range (IQR) | 4.2% | 3.5% |
| Standard Deviation (Sample) | 5.7% | 5.6% |
| Standard Deviation (Population) | 5.6% | 5.6% |
Similar Demographics by Divorced or Separated
Demographics Similar to Croatians by Divorced or Separated
In terms of divorced or separated, the demographic groups most similar to Croatians are Peruvian (11.9%, a difference of 0.020%), Immigrants from Zimbabwe (11.9%, a difference of 0.050%), Pakistani (11.9%, a difference of 0.050%), Immigrants from Grenada (11.9%, a difference of 0.080%), and Polish (11.9%, a difference of 0.11%).
| Demographics | Rating | Rank | Divorced or Separated |
| Immigrants | Netherlands | 83.9 /100 | #138 | Excellent 11.9% |
| Australians | 83.6 /100 | #139 | Excellent 11.9% |
| Lebanese | 83.4 /100 | #140 | Excellent 11.9% |
| Immigrants | Morocco | 82.9 /100 | #141 | Excellent 11.9% |
| Immigrants | Zimbabwe | 81.5 /100 | #142 | Excellent 11.9% |
| Pakistanis | 81.3 /100 | #143 | Excellent 11.9% |
| Peruvians | 80.9 /100 | #144 | Excellent 11.9% |
| Croatians | 80.6 /100 | #145 | Excellent 11.9% |
| Immigrants | Grenada | 79.1 /100 | #146 | Good 11.9% |
| Poles | 78.6 /100 | #147 | Good 11.9% |
| Italians | 77.8 /100 | #148 | Good 11.9% |
| Immigrants | Oceania | 77.7 /100 | #149 | Good 11.9% |
| Immigrants | Portugal | 77.3 /100 | #150 | Good 11.9% |
| Czechs | 76.4 /100 | #151 | Good 11.9% |
| Immigrants | Hungary | 73.7 /100 | #152 | Good 11.9% |
Demographics Similar to Delaware by Divorced or Separated
In terms of divorced or separated, the demographic groups most similar to Delaware are Subsaharan African (12.7%, a difference of 0.010%), Nonimmigrants (12.8%, a difference of 0.090%), Pueblo (12.7%, a difference of 0.13%), French (12.8%, a difference of 0.13%), and Immigrants from Zaire (12.7%, a difference of 0.17%).
| Demographics | Rating | Rank | Divorced or Separated |
| Spaniards | 0.2 /100 | #276 | Tragic 12.7% |
| Dominicans | 0.2 /100 | #277 | Tragic 12.7% |
| Lumbee | 0.2 /100 | #278 | Tragic 12.7% |
| Immigrants | Dominican Republic | 0.2 /100 | #279 | Tragic 12.7% |
| Immigrants | Zaire | 0.2 /100 | #280 | Tragic 12.7% |
| Pueblo | 0.2 /100 | #281 | Tragic 12.7% |
| Sub-Saharan Africans | 0.1 /100 | #282 | Tragic 12.7% |
| Delaware | 0.1 /100 | #283 | Tragic 12.7% |
| Immigrants | Nonimmigrants | 0.1 /100 | #284 | Tragic 12.8% |
| French | 0.1 /100 | #285 | Tragic 12.8% |
| Spanish | 0.1 /100 | #286 | Tragic 12.8% |
| Hondurans | 0.1 /100 | #287 | Tragic 12.8% |
| French Canadians | 0.1 /100 | #288 | Tragic 12.8% |
| Iroquois | 0.0 /100 | #289 | Tragic 12.9% |
| Pima | 0.0 /100 | #290 | Tragic 12.9% |