Croatian vs Canadian Divorced or Separated
COMPARE
Croatian
Canadian
Divorced or Separated
Divorced or Separated Comparison
Croatians
Canadians
11.9%
DIVORCED OR SEPARATED
80.6/ 100
METRIC RATING
145th/ 347
METRIC RANK
12.4%
DIVORCED OR SEPARATED
5.3/ 100
METRIC RATING
232nd/ 347
METRIC RANK
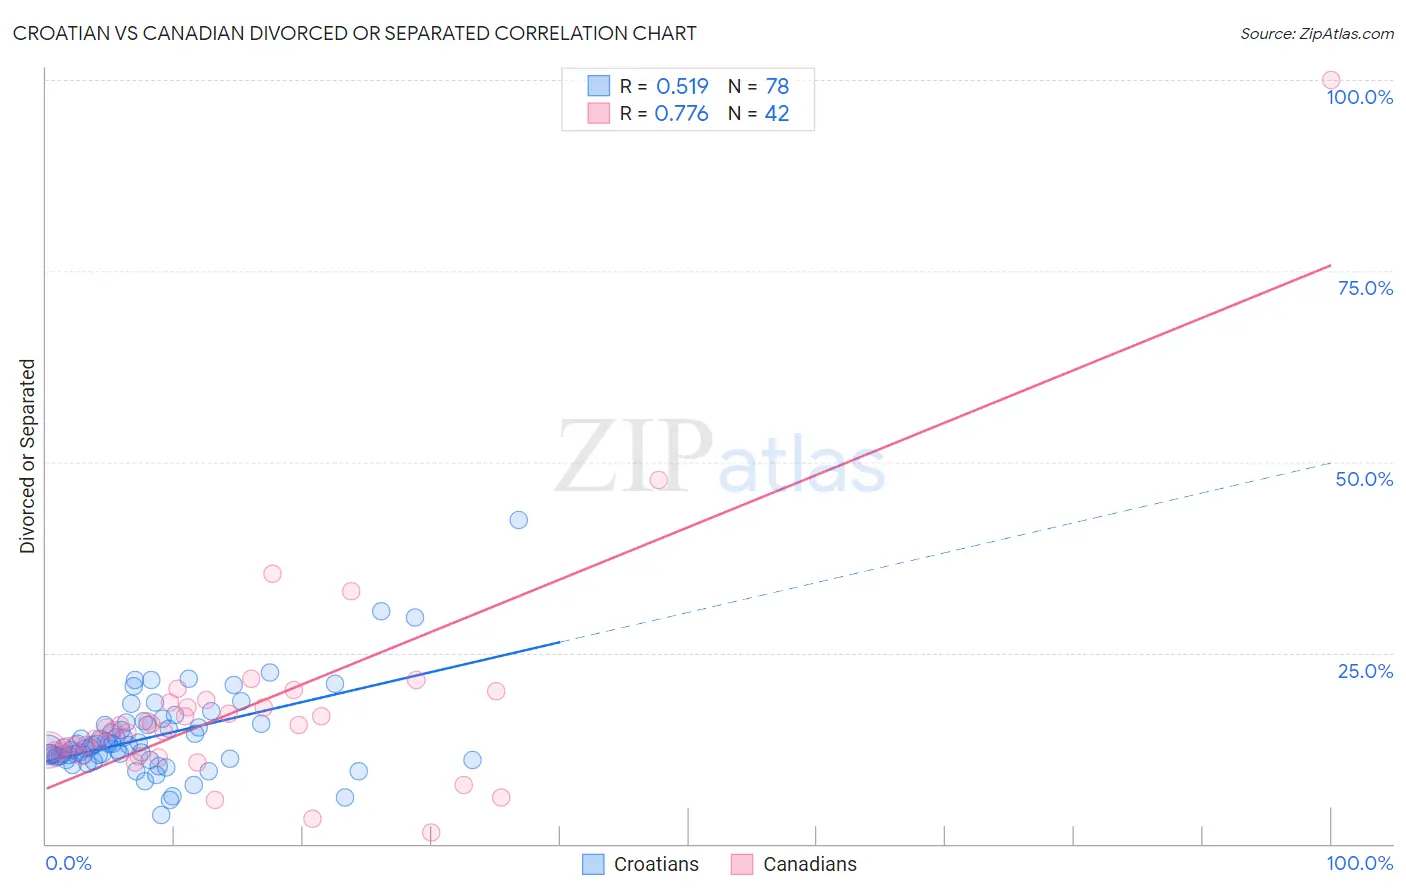
Croatian vs Canadian Divorced or Separated Correlation Chart
The statistical analysis conducted on geographies consisting of 375,586,631 people shows a substantial positive correlation between the proportion of Croatians and percentage of population currently divorced or separated in the United States with a correlation coefficient (R) of 0.519 and weighted average of 11.9%. Similarly, the statistical analysis conducted on geographies consisting of 437,381,276 people shows a strong positive correlation between the proportion of Canadians and percentage of population currently divorced or separated in the United States with a correlation coefficient (R) of 0.776 and weighted average of 12.4%, a difference of 3.8%.
Divorced or Separated Correlation Summary
| Measurement | Croatian | Canadian |
| Minimum | 3.7% | 1.4% |
| Maximum | 42.4% | 100.0% |
| Range | 38.7% | 98.6% |
| Mean | 14.0% | 17.8% |
| Median | 12.6% | 15.1% |
| Interquartile 25% (IQ1) | 11.4% | 12.1% |
| Interquartile 75% (IQ3) | 15.6% | 18.4% |
| Interquartile Range (IQR) | 4.2% | 6.3% |
| Standard Deviation (Sample) | 5.7% | 15.3% |
| Standard Deviation (Population) | 5.6% | 15.1% |
Similar Demographics by Divorced or Separated
Demographics Similar to Croatians by Divorced or Separated
In terms of divorced or separated, the demographic groups most similar to Croatians are Peruvian (11.9%, a difference of 0.020%), Immigrants from Zimbabwe (11.9%, a difference of 0.050%), Pakistani (11.9%, a difference of 0.050%), Immigrants from Grenada (11.9%, a difference of 0.080%), and Polish (11.9%, a difference of 0.11%).
| Demographics | Rating | Rank | Divorced or Separated |
| Immigrants | Netherlands | 83.9 /100 | #138 | Excellent 11.9% |
| Australians | 83.6 /100 | #139 | Excellent 11.9% |
| Lebanese | 83.4 /100 | #140 | Excellent 11.9% |
| Immigrants | Morocco | 82.9 /100 | #141 | Excellent 11.9% |
| Immigrants | Zimbabwe | 81.5 /100 | #142 | Excellent 11.9% |
| Pakistanis | 81.3 /100 | #143 | Excellent 11.9% |
| Peruvians | 80.9 /100 | #144 | Excellent 11.9% |
| Croatians | 80.6 /100 | #145 | Excellent 11.9% |
| Immigrants | Grenada | 79.1 /100 | #146 | Good 11.9% |
| Poles | 78.6 /100 | #147 | Good 11.9% |
| Italians | 77.8 /100 | #148 | Good 11.9% |
| Immigrants | Oceania | 77.7 /100 | #149 | Good 11.9% |
| Immigrants | Portugal | 77.3 /100 | #150 | Good 11.9% |
| Czechs | 76.4 /100 | #151 | Good 11.9% |
| Immigrants | Hungary | 73.7 /100 | #152 | Good 11.9% |
Demographics Similar to Canadians by Divorced or Separated
In terms of divorced or separated, the demographic groups most similar to Canadians are Malaysian (12.4%, a difference of 0.090%), West Indian (12.4%, a difference of 0.17%), Yugoslavian (12.3%, a difference of 0.19%), Immigrants from Bosnia and Herzegovina (12.4%, a difference of 0.19%), and Colombian (12.4%, a difference of 0.21%).
| Demographics | Rating | Rank | Divorced or Separated |
| Belgians | 9.7 /100 | #225 | Tragic 12.3% |
| Immigrants | Western Africa | 9.3 /100 | #226 | Tragic 12.3% |
| Hmong | 8.8 /100 | #227 | Tragic 12.3% |
| Immigrants | Cameroon | 8.3 /100 | #228 | Tragic 12.3% |
| Immigrants | Sudan | 8.2 /100 | #229 | Tragic 12.3% |
| Yakama | 7.8 /100 | #230 | Tragic 12.3% |
| Yugoslavians | 6.6 /100 | #231 | Tragic 12.3% |
| Canadians | 5.3 /100 | #232 | Tragic 12.4% |
| Malaysians | 4.8 /100 | #233 | Tragic 12.4% |
| West Indians | 4.4 /100 | #234 | Tragic 12.4% |
| Immigrants | Bosnia and Herzegovina | 4.3 /100 | #235 | Tragic 12.4% |
| Colombians | 4.2 /100 | #236 | Tragic 12.4% |
| Immigrants | Laos | 4.2 /100 | #237 | Tragic 12.4% |
| Sudanese | 4.0 /100 | #238 | Tragic 12.4% |
| Immigrants | Germany | 4.0 /100 | #239 | Tragic 12.4% |