Immigrants from Somalia vs Creek Single Father Households
COMPARE
Immigrants from Somalia
Creek
Single Father Households
Single Father Households Comparison
Immigrants from Somalia
Creek
2.5%
SINGLE FATHER HOUSEHOLDS
1.9/ 100
METRIC RATING
253rd/ 347
METRIC RANK
2.6%
SINGLE FATHER HOUSEHOLDS
0.2/ 100
METRIC RATING
271st/ 347
METRIC RANK
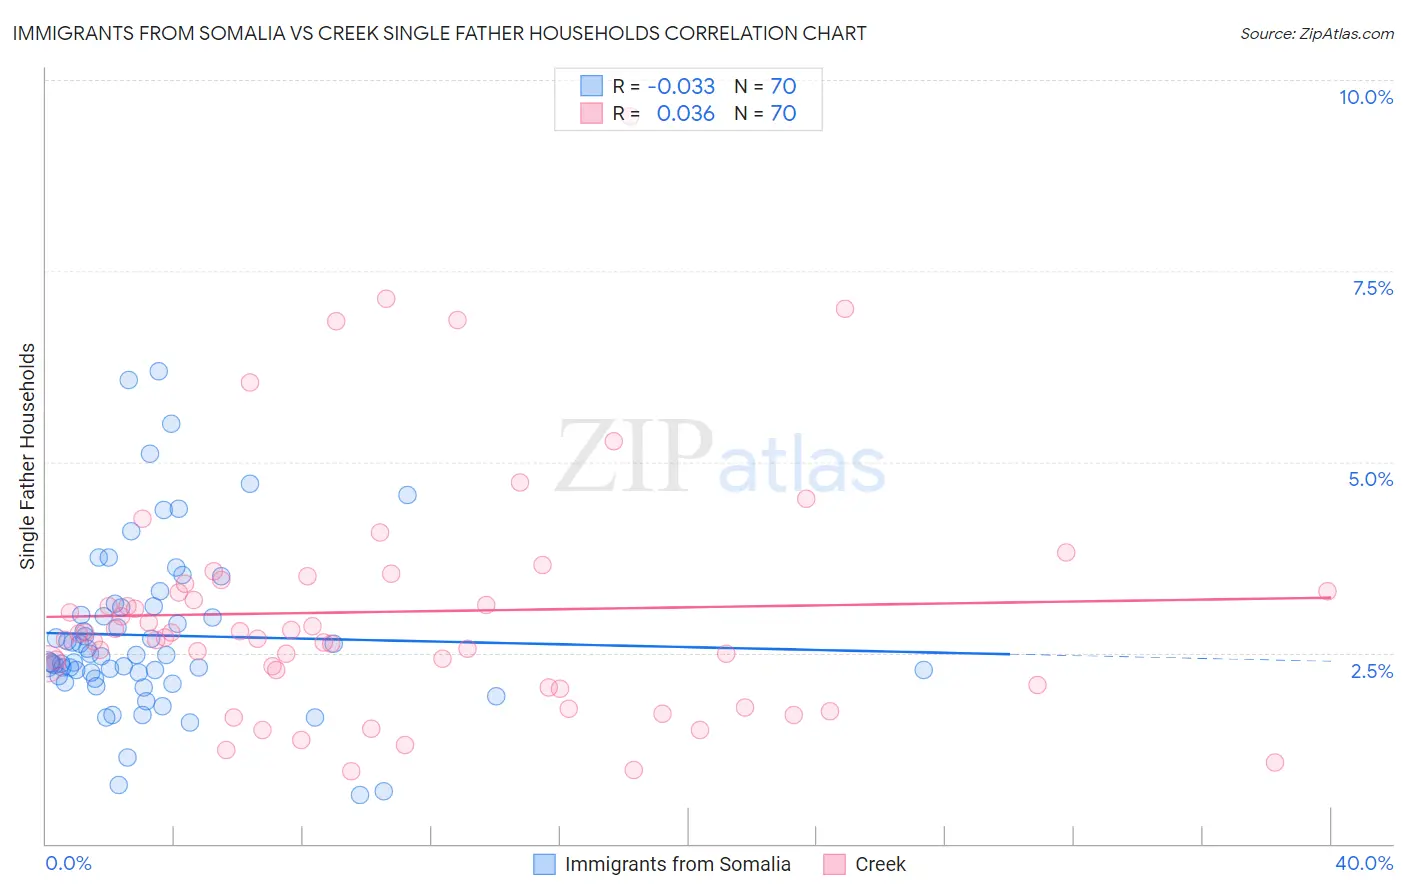
Immigrants from Somalia vs Creek Single Father Households Correlation Chart
The statistical analysis conducted on geographies consisting of 91,982,855 people shows no correlation between the proportion of Immigrants from Somalia and percentage of single father households in the United States with a correlation coefficient (R) of -0.033 and weighted average of 2.5%. Similarly, the statistical analysis conducted on geographies consisting of 177,693,364 people shows no correlation between the proportion of Creek and percentage of single father households in the United States with a correlation coefficient (R) of 0.036 and weighted average of 2.6%, a difference of 3.8%.
Single Father Households Correlation Summary
| Measurement | Immigrants from Somalia | Creek |
| Minimum | 0.64% | 0.96% |
| Maximum | 6.2% | 9.5% |
| Range | 5.5% | 8.6% |
| Mean | 2.7% | 3.0% |
| Median | 2.5% | 2.7% |
| Interquartile 25% (IQ1) | 2.2% | 2.1% |
| Interquartile 75% (IQ3) | 3.1% | 3.4% |
| Interquartile Range (IQR) | 0.90% | 1.3% |
| Standard Deviation (Sample) | 1.1% | 1.6% |
| Standard Deviation (Population) | 1.1% | 1.6% |
Demographics Similar to Immigrants from Somalia and Creek by Single Father Households
In terms of single father households, the demographic groups most similar to Immigrants from Somalia are Immigrants from Thailand (2.5%, a difference of 0.040%), Immigrants from Eritrea (2.5%, a difference of 0.070%), Tongan (2.5%, a difference of 0.45%), Potawatomi (2.5%, a difference of 0.51%), and Immigrants from Congo (2.5%, a difference of 0.79%). Similarly, the demographic groups most similar to Creek are Belizean (2.6%, a difference of 0.0%), Seminole (2.6%, a difference of 0.36%), Cuban (2.6%, a difference of 0.50%), Haitian (2.6%, a difference of 0.84%), and Guamanian/Chamorro (2.6%, a difference of 0.88%).
| Demographics | Rating | Rank | Single Father Households |
| Immigrants | Eritrea | 2.0 /100 | #252 | Tragic 2.5% |
| Immigrants | Somalia | 1.9 /100 | #253 | Tragic 2.5% |
| Immigrants | Thailand | 1.8 /100 | #254 | Tragic 2.5% |
| Tongans | 1.5 /100 | #255 | Tragic 2.5% |
| Potawatomi | 1.4 /100 | #256 | Tragic 2.5% |
| Immigrants | Congo | 1.2 /100 | #257 | Tragic 2.5% |
| Spanish | 1.1 /100 | #258 | Tragic 2.5% |
| Comanche | 1.0 /100 | #259 | Tragic 2.5% |
| Immigrants | Caribbean | 1.0 /100 | #260 | Tragic 2.5% |
| Immigrants | Belize | 0.9 /100 | #261 | Tragic 2.5% |
| Immigrants | Liberia | 0.8 /100 | #262 | Tragic 2.5% |
| Dominicans | 0.8 /100 | #263 | Tragic 2.5% |
| Indonesians | 0.5 /100 | #264 | Tragic 2.6% |
| Immigrants | Micronesia | 0.5 /100 | #265 | Tragic 2.6% |
| French American Indians | 0.5 /100 | #266 | Tragic 2.6% |
| Guamanians/Chamorros | 0.4 /100 | #267 | Tragic 2.6% |
| Haitians | 0.4 /100 | #268 | Tragic 2.6% |
| Cubans | 0.3 /100 | #269 | Tragic 2.6% |
| Seminole | 0.3 /100 | #270 | Tragic 2.6% |
| Creek | 0.2 /100 | #271 | Tragic 2.6% |
| Belizeans | 0.2 /100 | #272 | Tragic 2.6% |