Immigrants from Northern Europe vs Cuban Family Households
COMPARE
Immigrants from Northern Europe
Cuban
Family Households
Family Households Comparison
Immigrants from Northern Europe
Cubans
63.8%
FAMILY HOUSEHOLDS
8.8/ 100
METRIC RATING
213th/ 347
METRIC RANK
67.7%
FAMILY HOUSEHOLDS
100.0/ 100
METRIC RATING
21st/ 347
METRIC RANK
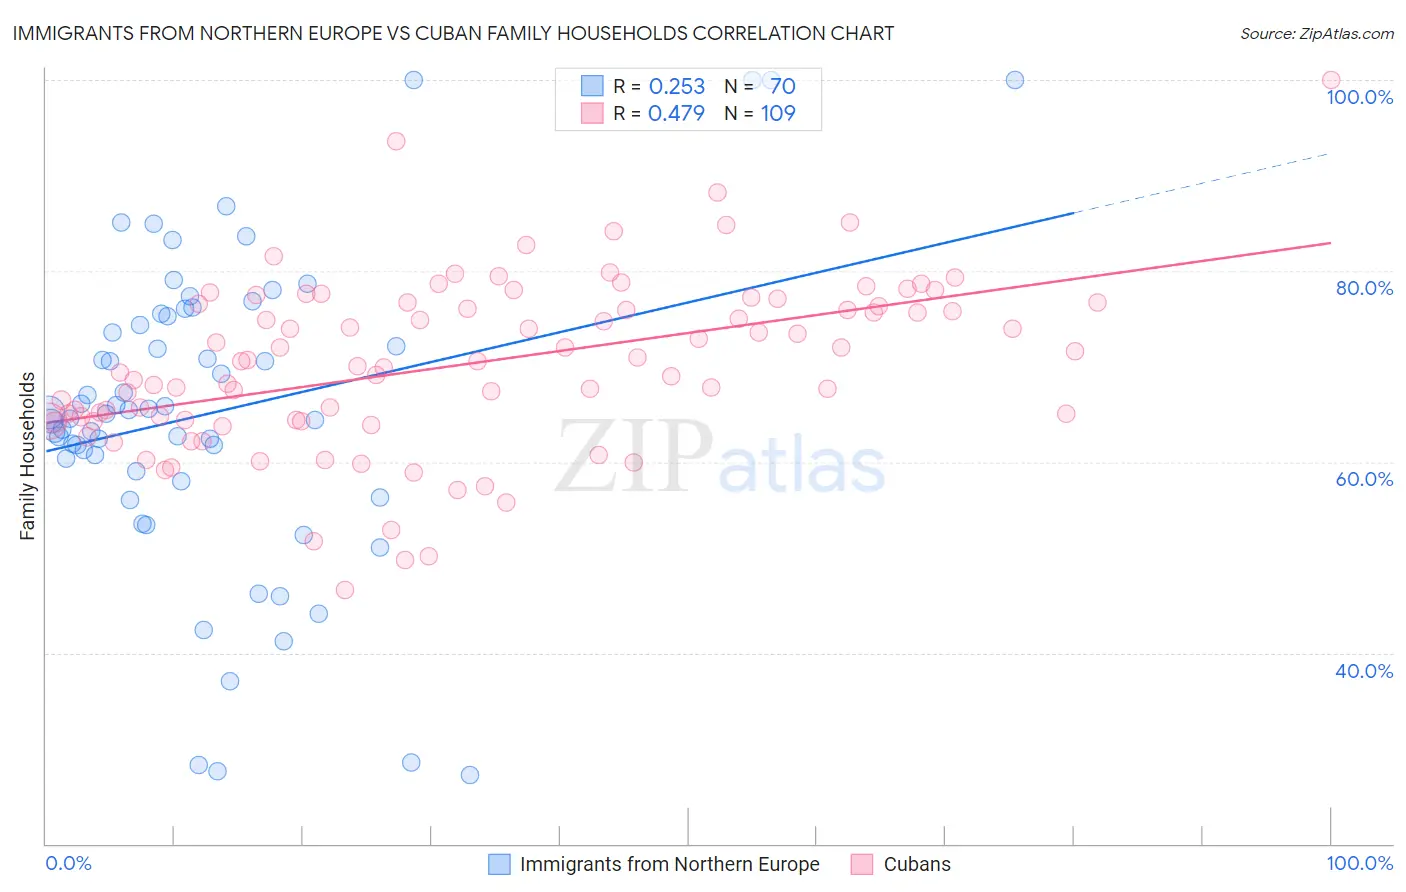
Immigrants from Northern Europe vs Cuban Family Households Correlation Chart
The statistical analysis conducted on geographies consisting of 476,950,650 people shows a weak positive correlation between the proportion of Immigrants from Northern Europe and percentage of family households in the United States with a correlation coefficient (R) of 0.253 and weighted average of 63.8%. Similarly, the statistical analysis conducted on geographies consisting of 448,974,040 people shows a moderate positive correlation between the proportion of Cubans and percentage of family households in the United States with a correlation coefficient (R) of 0.479 and weighted average of 67.7%, a difference of 6.2%.
Family Households Correlation Summary
| Measurement | Immigrants from Northern Europe | Cuban |
| Minimum | 27.1% | 46.6% |
| Maximum | 100.0% | 100.0% |
| Range | 72.9% | 53.4% |
| Mean | 65.2% | 70.2% |
| Median | 65.1% | 70.5% |
| Interquartile 25% (IQ1) | 59.0% | 64.3% |
| Interquartile 75% (IQ3) | 75.3% | 76.6% |
| Interquartile Range (IQR) | 16.3% | 12.3% |
| Standard Deviation (Sample) | 16.2% | 9.0% |
| Standard Deviation (Population) | 16.1% | 9.0% |
Similar Demographics by Family Households
Demographics Similar to Immigrants from Northern Europe by Family Households
In terms of family households, the demographic groups most similar to Immigrants from Northern Europe are Shoshone (63.8%, a difference of 0.020%), Immigrants from Netherlands (63.8%, a difference of 0.020%), Immigrants from Thailand (63.8%, a difference of 0.030%), Celtic (63.8%, a difference of 0.040%), and Belgian (63.8%, a difference of 0.060%).
| Demographics | Rating | Rank | Family Households |
| Immigrants | Lithuania | 12.1 /100 | #206 | Poor 63.9% |
| Nigerians | 11.5 /100 | #207 | Poor 63.9% |
| Immigrants | Bangladesh | 11.4 /100 | #208 | Poor 63.9% |
| Sierra Leoneans | 11.2 /100 | #209 | Poor 63.9% |
| Immigrants | Thailand | 9.6 /100 | #210 | Tragic 63.8% |
| Shoshone | 9.4 /100 | #211 | Tragic 63.8% |
| Immigrants | Netherlands | 9.4 /100 | #212 | Tragic 63.8% |
| Immigrants | Northern Europe | 8.8 /100 | #213 | Tragic 63.8% |
| Celtics | 8.0 /100 | #214 | Tragic 63.8% |
| Belgians | 7.6 /100 | #215 | Tragic 63.8% |
| Croatians | 7.3 /100 | #216 | Tragic 63.8% |
| Osage | 7.0 /100 | #217 | Tragic 63.7% |
| Marshallese | 6.9 /100 | #218 | Tragic 63.7% |
| Macedonians | 6.5 /100 | #219 | Tragic 63.7% |
| Immigrants | Europe | 6.4 /100 | #220 | Tragic 63.7% |
Demographics Similar to Cubans by Family Households
In terms of family households, the demographic groups most similar to Cubans are Sri Lankan (67.7%, a difference of 0.040%), Inupiat (67.8%, a difference of 0.050%), Immigrants from Pakistan (67.7%, a difference of 0.12%), Samoan (67.9%, a difference of 0.30%), and Immigrants from South Eastern Asia (67.5%, a difference of 0.41%).
| Demographics | Rating | Rank | Family Households |
| Immigrants | Cuba | 100.0 /100 | #14 | Exceptional 68.2% |
| Assyrians/Chaldeans/Syriacs | 100.0 /100 | #15 | Exceptional 68.2% |
| Immigrants | Vietnam | 100.0 /100 | #16 | Exceptional 68.2% |
| Chinese | 100.0 /100 | #17 | Exceptional 68.1% |
| Immigrants | Taiwan | 100.0 /100 | #18 | Exceptional 68.0% |
| Samoans | 100.0 /100 | #19 | Exceptional 67.9% |
| Inupiat | 100.0 /100 | #20 | Exceptional 67.8% |
| Cubans | 100.0 /100 | #21 | Exceptional 67.7% |
| Sri Lankans | 100.0 /100 | #22 | Exceptional 67.7% |
| Immigrants | Pakistan | 100.0 /100 | #23 | Exceptional 67.7% |
| Immigrants | South Eastern Asia | 100.0 /100 | #24 | Exceptional 67.5% |
| Immigrants | Nicaragua | 100.0 /100 | #25 | Exceptional 67.5% |
| Immigrants | India | 100.0 /100 | #26 | Exceptional 67.4% |
| Hispanics or Latinos | 100.0 /100 | #27 | Exceptional 67.4% |
| Hawaiians | 100.0 /100 | #28 | Exceptional 67.4% |