Scottish vs Cuban Family Households
COMPARE
Scottish
Cuban
Family Households
Family Households Comparison
Scottish
Cubans
64.5%
FAMILY HOUSEHOLDS
70.9/ 100
METRIC RATING
152nd/ 347
METRIC RANK
67.7%
FAMILY HOUSEHOLDS
100.0/ 100
METRIC RATING
21st/ 347
METRIC RANK
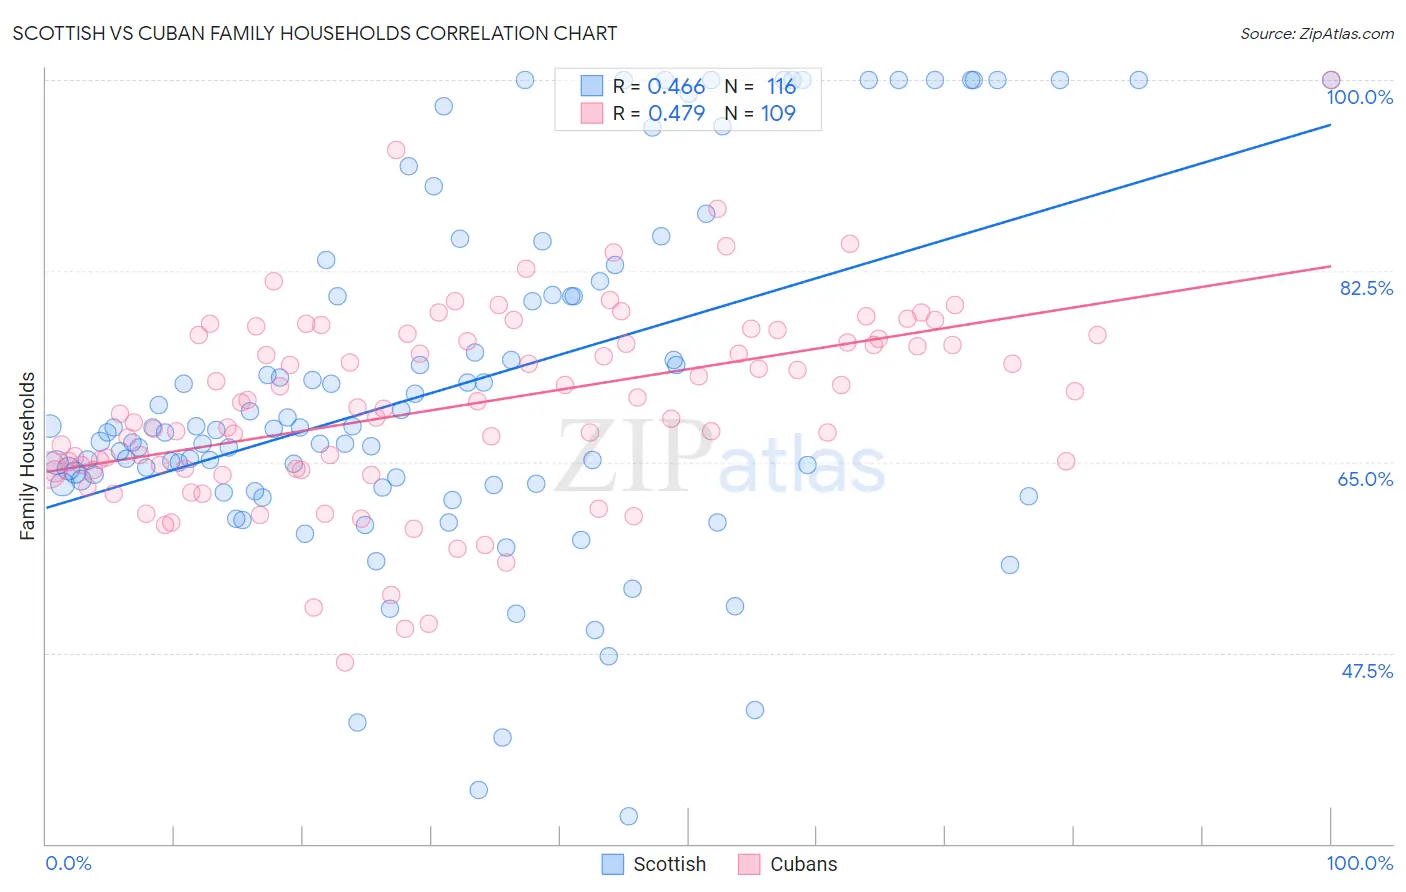
Scottish vs Cuban Family Households Correlation Chart
The statistical analysis conducted on geographies consisting of 566,567,551 people shows a moderate positive correlation between the proportion of Scottish and percentage of family households in the United States with a correlation coefficient (R) of 0.466 and weighted average of 64.5%. Similarly, the statistical analysis conducted on geographies consisting of 448,974,040 people shows a moderate positive correlation between the proportion of Cubans and percentage of family households in the United States with a correlation coefficient (R) of 0.479 and weighted average of 67.7%, a difference of 5.1%.
Family Households Correlation Summary
| Measurement | Scottish | Cuban |
| Minimum | 32.6% | 46.6% |
| Maximum | 100.0% | 100.0% |
| Range | 67.4% | 53.4% |
| Mean | 71.9% | 70.2% |
| Median | 67.9% | 70.5% |
| Interquartile 25% (IQ1) | 63.0% | 64.3% |
| Interquartile 75% (IQ3) | 80.9% | 76.6% |
| Interquartile Range (IQR) | 18.0% | 12.3% |
| Standard Deviation (Sample) | 16.1% | 9.0% |
| Standard Deviation (Population) | 16.1% | 9.0% |
Similar Demographics by Family Households
Demographics Similar to Scottish by Family Households
In terms of family households, the demographic groups most similar to Scottish are Swedish (64.5%, a difference of 0.020%), Austrian (64.5%, a difference of 0.040%), Uruguayan (64.5%, a difference of 0.050%), Czech (64.5%, a difference of 0.060%), and Romanian (64.5%, a difference of 0.070%).
| Demographics | Rating | Rank | Family Households |
| Welsh | 80.1 /100 | #145 | Excellent 64.6% |
| Immigrants | Romania | 77.0 /100 | #146 | Good 64.6% |
| Immigrants | Chile | 76.5 /100 | #147 | Good 64.6% |
| Delaware | 76.3 /100 | #148 | Good 64.6% |
| Sioux | 76.3 /100 | #149 | Good 64.6% |
| Romanians | 75.3 /100 | #150 | Good 64.5% |
| Syrians | 75.2 /100 | #151 | Good 64.5% |
| Scottish | 70.9 /100 | #152 | Good 64.5% |
| Swedes | 69.8 /100 | #153 | Good 64.5% |
| Austrians | 68.5 /100 | #154 | Good 64.5% |
| Uruguayans | 67.7 /100 | #155 | Good 64.5% |
| Czechs | 67.0 /100 | #156 | Good 64.5% |
| Canadians | 66.6 /100 | #157 | Good 64.4% |
| Lebanese | 66.4 /100 | #158 | Good 64.4% |
| Germans | 65.8 /100 | #159 | Good 64.4% |
Demographics Similar to Cubans by Family Households
In terms of family households, the demographic groups most similar to Cubans are Sri Lankan (67.7%, a difference of 0.040%), Inupiat (67.8%, a difference of 0.050%), Immigrants from Pakistan (67.7%, a difference of 0.12%), Samoan (67.9%, a difference of 0.30%), and Immigrants from South Eastern Asia (67.5%, a difference of 0.41%).
| Demographics | Rating | Rank | Family Households |
| Immigrants | Cuba | 100.0 /100 | #14 | Exceptional 68.2% |
| Assyrians/Chaldeans/Syriacs | 100.0 /100 | #15 | Exceptional 68.2% |
| Immigrants | Vietnam | 100.0 /100 | #16 | Exceptional 68.2% |
| Chinese | 100.0 /100 | #17 | Exceptional 68.1% |
| Immigrants | Taiwan | 100.0 /100 | #18 | Exceptional 68.0% |
| Samoans | 100.0 /100 | #19 | Exceptional 67.9% |
| Inupiat | 100.0 /100 | #20 | Exceptional 67.8% |
| Cubans | 100.0 /100 | #21 | Exceptional 67.7% |
| Sri Lankans | 100.0 /100 | #22 | Exceptional 67.7% |
| Immigrants | Pakistan | 100.0 /100 | #23 | Exceptional 67.7% |
| Immigrants | South Eastern Asia | 100.0 /100 | #24 | Exceptional 67.5% |
| Immigrants | Nicaragua | 100.0 /100 | #25 | Exceptional 67.5% |
| Immigrants | India | 100.0 /100 | #26 | Exceptional 67.4% |
| Hispanics or Latinos | 100.0 /100 | #27 | Exceptional 67.4% |
| Hawaiians | 100.0 /100 | #28 | Exceptional 67.4% |