Creek vs Cuban High School Diploma
COMPARE
Creek
Cuban
High School Diploma
High School Diploma Comparison
Creek
Cubans
88.3%
HIGH SCHOOL DIPLOMA
6.9/ 100
METRIC RATING
225th/ 347
METRIC RANK
85.4%
HIGH SCHOOL DIPLOMA
0.0/ 100
METRIC RATING
303rd/ 347
METRIC RANK
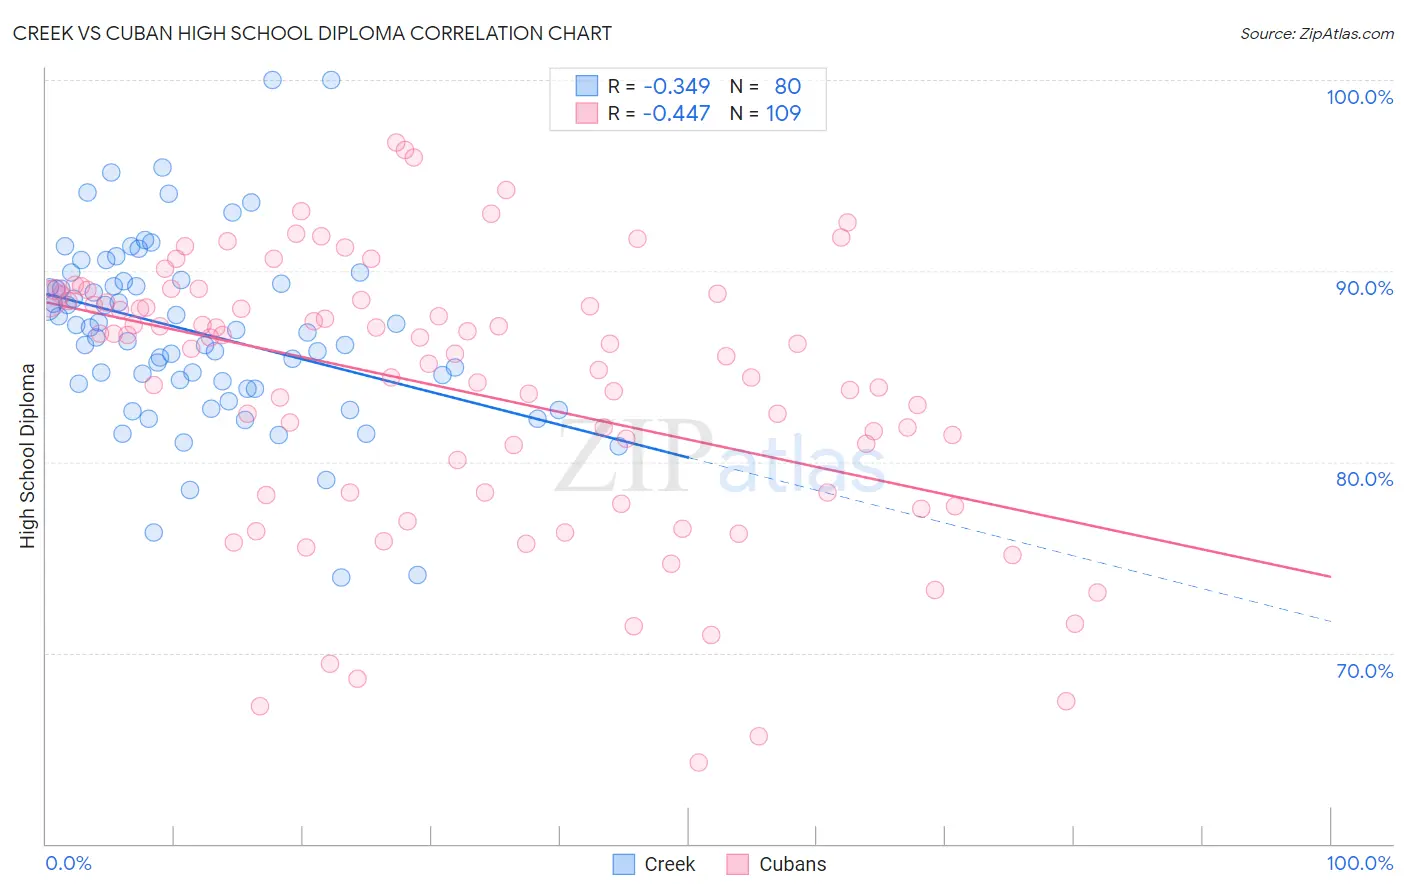
Creek vs Cuban High School Diploma Correlation Chart
The statistical analysis conducted on geographies consisting of 178,480,629 people shows a mild negative correlation between the proportion of Creek and percentage of population with at least high school diploma education in the United States with a correlation coefficient (R) of -0.349 and weighted average of 88.3%. Similarly, the statistical analysis conducted on geographies consisting of 449,373,028 people shows a moderate negative correlation between the proportion of Cubans and percentage of population with at least high school diploma education in the United States with a correlation coefficient (R) of -0.447 and weighted average of 85.4%, a difference of 3.4%.
High School Diploma Correlation Summary
| Measurement | Creek | Cuban |
| Minimum | 74.0% | 64.2% |
| Maximum | 100.0% | 96.7% |
| Range | 26.0% | 32.5% |
| Mean | 86.8% | 83.8% |
| Median | 86.8% | 85.9% |
| Interquartile 25% (IQ1) | 83.9% | 78.4% |
| Interquartile 75% (IQ3) | 89.4% | 88.5% |
| Interquartile Range (IQR) | 5.5% | 10.1% |
| Standard Deviation (Sample) | 4.8% | 7.1% |
| Standard Deviation (Population) | 4.8% | 7.0% |
Similar Demographics by High School Diploma
Demographics Similar to Creek by High School Diploma
In terms of high school diploma, the demographic groups most similar to Creek are Shoshone (88.3%, a difference of 0.010%), Immigrants from Zaire (88.3%, a difference of 0.040%), Colville (88.3%, a difference of 0.050%), Uruguayan (88.2%, a difference of 0.080%), and Immigrants from Afghanistan (88.3%, a difference of 0.090%).
| Demographics | Rating | Rank | High School Diploma |
| Immigrants | Bolivia | 10.3 /100 | #218 | Poor 88.4% |
| Costa Ricans | 9.6 /100 | #219 | Tragic 88.4% |
| Tongans | 9.5 /100 | #220 | Tragic 88.4% |
| Immigrants | Afghanistan | 8.6 /100 | #221 | Tragic 88.3% |
| Colville | 7.8 /100 | #222 | Tragic 88.3% |
| Immigrants | Zaire | 7.6 /100 | #223 | Tragic 88.3% |
| Shoshone | 7.0 /100 | #224 | Tragic 88.3% |
| Creek | 6.9 /100 | #225 | Tragic 88.3% |
| Uruguayans | 5.6 /100 | #226 | Tragic 88.2% |
| Immigrants | Liberia | 5.5 /100 | #227 | Tragic 88.2% |
| Kiowa | 5.3 /100 | #228 | Tragic 88.2% |
| Nigerians | 5.2 /100 | #229 | Tragic 88.2% |
| Blackfeet | 4.2 /100 | #230 | Tragic 88.1% |
| Colombians | 3.8 /100 | #231 | Tragic 88.1% |
| Immigrants | Middle Africa | 3.4 /100 | #232 | Tragic 88.0% |
Demographics Similar to Cubans by High School Diploma
In terms of high school diploma, the demographic groups most similar to Cubans are Immigrants from Haiti (85.4%, a difference of 0.0%), Vietnamese (85.4%, a difference of 0.040%), Immigrants from Bangladesh (85.5%, a difference of 0.060%), Guyanese (85.5%, a difference of 0.080%), and Nepalese (85.3%, a difference of 0.11%).
| Demographics | Rating | Rank | High School Diploma |
| Immigrants | Cambodia | 0.0 /100 | #296 | Tragic 85.6% |
| Immigrants | Grenada | 0.0 /100 | #297 | Tragic 85.6% |
| Natives/Alaskans | 0.0 /100 | #298 | Tragic 85.6% |
| Guyanese | 0.0 /100 | #299 | Tragic 85.5% |
| Immigrants | Bangladesh | 0.0 /100 | #300 | Tragic 85.5% |
| Vietnamese | 0.0 /100 | #301 | Tragic 85.4% |
| Immigrants | Haiti | 0.0 /100 | #302 | Tragic 85.4% |
| Cubans | 0.0 /100 | #303 | Tragic 85.4% |
| Nepalese | 0.0 /100 | #304 | Tragic 85.3% |
| Immigrants | Portugal | 0.0 /100 | #305 | Tragic 85.3% |
| Immigrants | Guyana | 0.0 /100 | #306 | Tragic 85.3% |
| Navajo | 0.0 /100 | #307 | Tragic 85.2% |
| Immigrants | Armenia | 0.0 /100 | #308 | Tragic 85.2% |
| Immigrants | Dominica | 0.0 /100 | #309 | Tragic 85.2% |
| Apache | 0.0 /100 | #310 | Tragic 85.1% |