Cree vs Immigrants from Western Africa Births to Unmarried Women
COMPARE
Cree
Immigrants from Western Africa
Births to Unmarried Women
Births to Unmarried Women Comparison
Cree
Immigrants from Western Africa
37.0%
BIRTHS TO UNMARRIED WOMEN
0.1/ 100
METRIC RATING
274th/ 347
METRIC RANK
36.0%
BIRTHS TO UNMARRIED WOMEN
0.3/ 100
METRIC RATING
251st/ 347
METRIC RANK
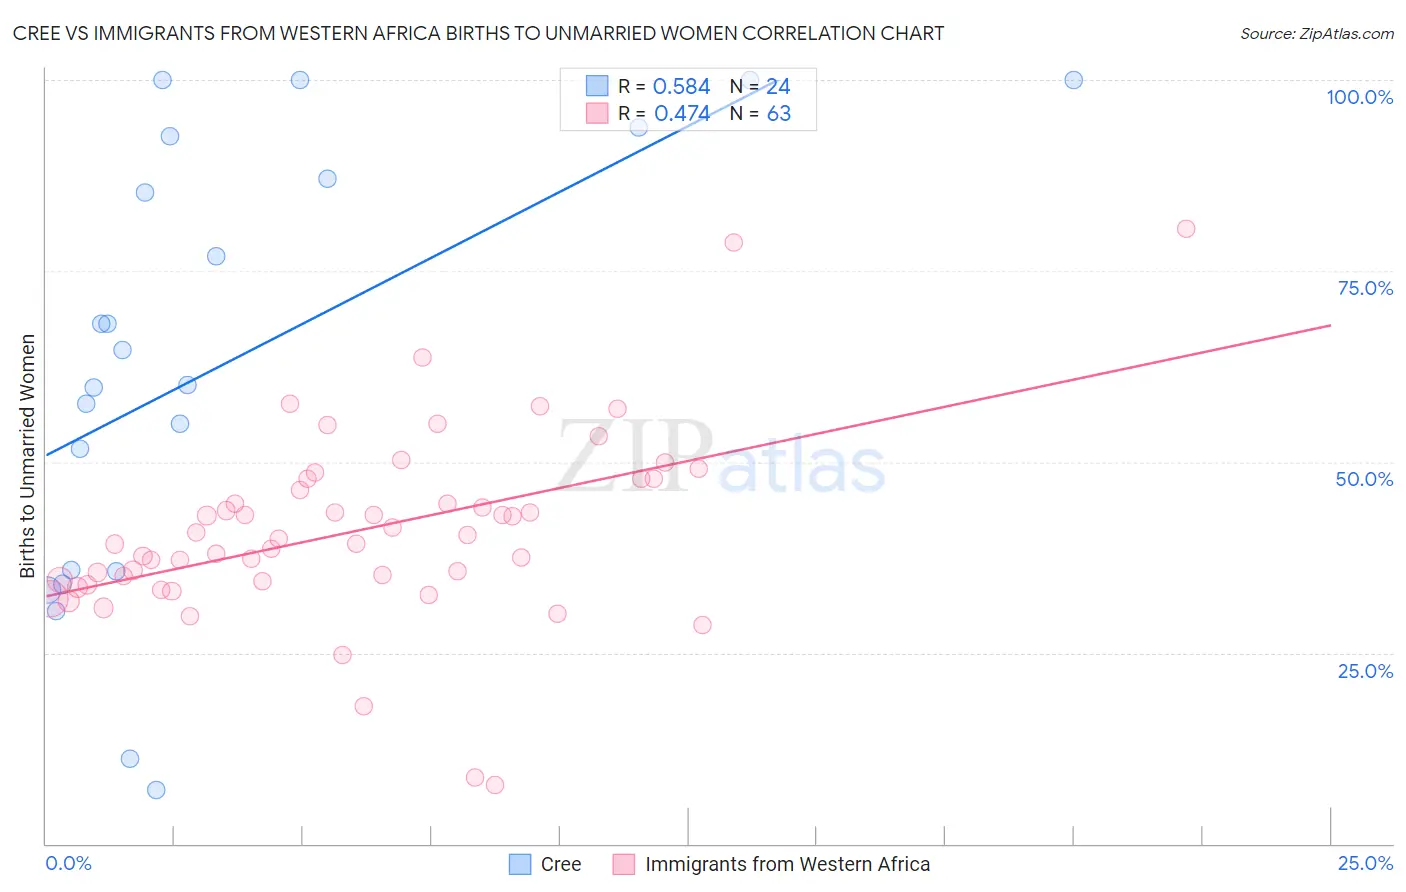
Cree vs Immigrants from Western Africa Births to Unmarried Women Correlation Chart
The statistical analysis conducted on geographies consisting of 74,807,025 people shows a substantial positive correlation between the proportion of Cree and percentage of births to unmarried women in the United States with a correlation coefficient (R) of 0.584 and weighted average of 37.0%. Similarly, the statistical analysis conducted on geographies consisting of 339,836,557 people shows a moderate positive correlation between the proportion of Immigrants from Western Africa and percentage of births to unmarried women in the United States with a correlation coefficient (R) of 0.474 and weighted average of 36.0%, a difference of 2.8%.
Births to Unmarried Women Correlation Summary
| Measurement | Cree | Immigrants from Western Africa |
| Minimum | 7.1% | 7.8% |
| Maximum | 100.0% | 80.6% |
| Range | 92.9% | 72.8% |
| Mean | 62.8% | 41.0% |
| Median | 62.3% | 39.9% |
| Interquartile 25% (IQ1) | 35.7% | 34.3% |
| Interquartile 75% (IQ3) | 89.8% | 47.8% |
| Interquartile Range (IQR) | 54.1% | 13.5% |
| Standard Deviation (Sample) | 28.7% | 12.4% |
| Standard Deviation (Population) | 28.1% | 12.3% |
Similar Demographics by Births to Unmarried Women
Demographics Similar to Cree by Births to Unmarried Women
In terms of births to unmarried women, the demographic groups most similar to Cree are Barbadian (37.0%, a difference of 0.030%), Mexican (36.9%, a difference of 0.090%), Choctaw (36.9%, a difference of 0.21%), Belizean (37.0%, a difference of 0.22%), and Immigrants from Barbados (36.8%, a difference of 0.43%).
| Demographics | Rating | Rank | Births to Unmarried Women |
| Central Americans | 0.1 /100 | #267 | Tragic 36.7% |
| Comanche | 0.1 /100 | #268 | Tragic 36.7% |
| Senegalese | 0.1 /100 | #269 | Tragic 36.8% |
| Immigrants | Congo | 0.1 /100 | #270 | Tragic 36.8% |
| Immigrants | Barbados | 0.1 /100 | #271 | Tragic 36.8% |
| Choctaw | 0.1 /100 | #272 | Tragic 36.9% |
| Mexicans | 0.1 /100 | #273 | Tragic 36.9% |
| Cree | 0.1 /100 | #274 | Tragic 37.0% |
| Barbadians | 0.1 /100 | #275 | Tragic 37.0% |
| Belizeans | 0.1 /100 | #276 | Tragic 37.0% |
| Guatemalans | 0.1 /100 | #277 | Tragic 37.1% |
| Immigrants | Latin America | 0.1 /100 | #278 | Tragic 37.1% |
| West Indians | 0.1 /100 | #279 | Tragic 37.3% |
| Immigrants | St. Vincent and the Grenadines | 0.1 /100 | #280 | Tragic 37.3% |
| Immigrants | Belize | 0.1 /100 | #281 | Tragic 37.3% |
Demographics Similar to Immigrants from Western Africa by Births to Unmarried Women
In terms of births to unmarried women, the demographic groups most similar to Immigrants from Western Africa are Salvadoran (36.0%, a difference of 0.12%), Mexican American Indian (35.7%, a difference of 0.57%), Immigrants from Portugal (36.2%, a difference of 0.58%), Potawatomi (36.2%, a difference of 0.81%), and Chickasaw (36.3%, a difference of 0.95%).
| Demographics | Rating | Rank | Births to Unmarried Women |
| Guyanese | 0.9 /100 | #244 | Tragic 35.2% |
| Shoshone | 0.8 /100 | #245 | Tragic 35.3% |
| Nigerians | 0.7 /100 | #246 | Tragic 35.3% |
| Immigrants | Nigeria | 0.7 /100 | #247 | Tragic 35.4% |
| Immigrants | Nonimmigrants | 0.6 /100 | #248 | Tragic 35.5% |
| Bermudans | 0.6 /100 | #249 | Tragic 35.5% |
| Mexican American Indians | 0.4 /100 | #250 | Tragic 35.7% |
| Immigrants | Western Africa | 0.3 /100 | #251 | Tragic 36.0% |
| Salvadorans | 0.3 /100 | #252 | Tragic 36.0% |
| Immigrants | Portugal | 0.2 /100 | #253 | Tragic 36.2% |
| Potawatomi | 0.2 /100 | #254 | Tragic 36.2% |
| Chickasaw | 0.2 /100 | #255 | Tragic 36.3% |
| Immigrants | Trinidad and Tobago | 0.2 /100 | #256 | Tragic 36.3% |
| Immigrants | Grenada | 0.2 /100 | #257 | Tragic 36.3% |
| Americans | 0.2 /100 | #258 | Tragic 36.4% |