Cree vs Immigrants from Western Africa Currently Married
COMPARE
Cree
Immigrants from Western Africa
Currently Married
Currently Married Comparison
Cree
Immigrants from Western Africa
44.9%
CURRENTLY MARRIED
1.7/ 100
METRIC RATING
229th/ 347
METRIC RANK
42.4%
CURRENTLY MARRIED
0.0/ 100
METRIC RATING
295th/ 347
METRIC RANK
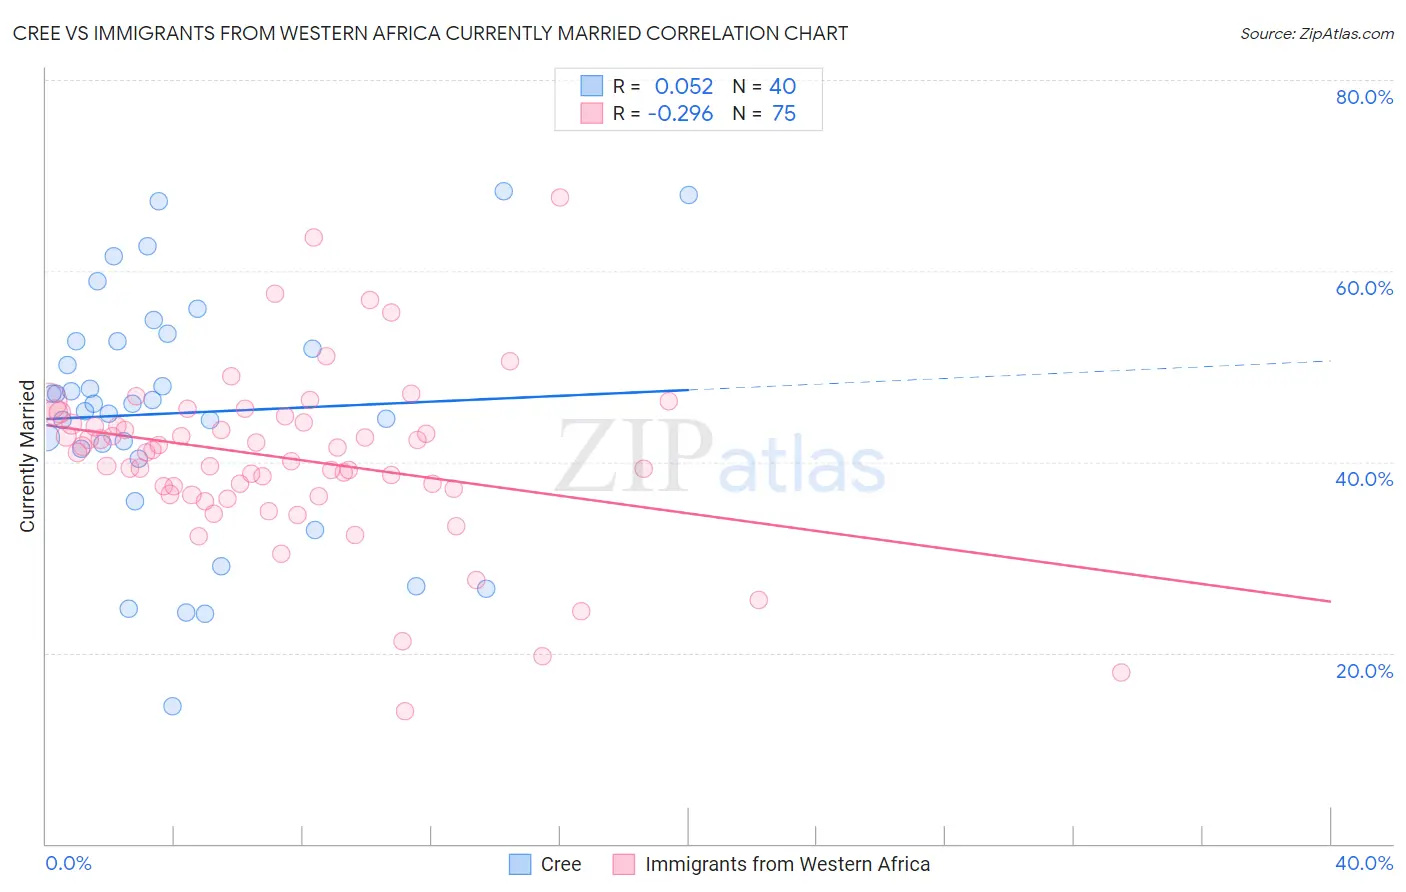
Cree vs Immigrants from Western Africa Currently Married Correlation Chart
The statistical analysis conducted on geographies consisting of 76,211,685 people shows a slight positive correlation between the proportion of Cree and percentage of population currently married in the United States with a correlation coefficient (R) of 0.052 and weighted average of 44.9%. Similarly, the statistical analysis conducted on geographies consisting of 357,817,257 people shows a weak negative correlation between the proportion of Immigrants from Western Africa and percentage of population currently married in the United States with a correlation coefficient (R) of -0.296 and weighted average of 42.4%, a difference of 5.9%.
Currently Married Correlation Summary
| Measurement | Cree | Immigrants from Western Africa |
| Minimum | 14.4% | 13.9% |
| Maximum | 68.3% | 67.7% |
| Range | 53.9% | 53.8% |
| Mean | 45.1% | 40.3% |
| Median | 46.1% | 41.0% |
| Interquartile 25% (IQ1) | 40.8% | 36.6% |
| Interquartile 75% (IQ3) | 52.6% | 44.1% |
| Interquartile Range (IQR) | 11.8% | 7.5% |
| Standard Deviation (Sample) | 12.7% | 9.0% |
| Standard Deviation (Population) | 12.5% | 8.9% |
Similar Demographics by Currently Married
Demographics Similar to Cree by Currently Married
In terms of currently married, the demographic groups most similar to Cree are Immigrants from Kenya (44.9%, a difference of 0.040%), Immigrants from Panama (44.9%, a difference of 0.080%), Spanish American (45.0%, a difference of 0.19%), Immigrants from Uruguay (45.0%, a difference of 0.19%), and Comanche (45.0%, a difference of 0.20%).
| Demographics | Rating | Rank | Currently Married |
| Immigrants | Azores | 2.5 /100 | #222 | Tragic 45.1% |
| Immigrants | Laos | 2.3 /100 | #223 | Tragic 45.0% |
| Immigrants | Uganda | 2.2 /100 | #224 | Tragic 45.0% |
| French American Indians | 2.2 /100 | #225 | Tragic 45.0% |
| Comanche | 2.1 /100 | #226 | Tragic 45.0% |
| Spanish Americans | 2.1 /100 | #227 | Tragic 45.0% |
| Immigrants | Uruguay | 2.0 /100 | #228 | Tragic 45.0% |
| Cree | 1.7 /100 | #229 | Tragic 44.9% |
| Immigrants | Kenya | 1.6 /100 | #230 | Tragic 44.9% |
| Immigrants | Panama | 1.5 /100 | #231 | Tragic 44.9% |
| Nepalese | 1.2 /100 | #232 | Tragic 44.7% |
| Immigrants | Saudi Arabia | 1.1 /100 | #233 | Tragic 44.7% |
| Iroquois | 1.1 /100 | #234 | Tragic 44.7% |
| Alaskan Athabascans | 0.9 /100 | #235 | Tragic 44.6% |
| Cubans | 0.9 /100 | #236 | Tragic 44.6% |
Demographics Similar to Immigrants from Western Africa by Currently Married
In terms of currently married, the demographic groups most similar to Immigrants from Western Africa are Menominee (42.3%, a difference of 0.21%), Cheyenne (42.2%, a difference of 0.31%), Honduran (42.5%, a difference of 0.33%), Immigrants from Honduras (42.2%, a difference of 0.40%), and Liberian (42.2%, a difference of 0.44%).
| Demographics | Rating | Rank | Currently Married |
| Natives/Alaskans | 0.0 /100 | #288 | Tragic 42.8% |
| Paiute | 0.0 /100 | #289 | Tragic 42.7% |
| Immigrants | Ghana | 0.0 /100 | #290 | Tragic 42.7% |
| Immigrants | Guatemala | 0.0 /100 | #291 | Tragic 42.6% |
| Sub-Saharan Africans | 0.0 /100 | #292 | Tragic 42.6% |
| Yuman | 0.0 /100 | #293 | Tragic 42.6% |
| Hondurans | 0.0 /100 | #294 | Tragic 42.5% |
| Immigrants | Western Africa | 0.0 /100 | #295 | Tragic 42.4% |
| Menominee | 0.0 /100 | #296 | Tragic 42.3% |
| Cheyenne | 0.0 /100 | #297 | Tragic 42.2% |
| Immigrants | Honduras | 0.0 /100 | #298 | Tragic 42.2% |
| Liberians | 0.0 /100 | #299 | Tragic 42.2% |
| Belizeans | 0.0 /100 | #300 | Tragic 42.2% |
| Immigrants | Yemen | 0.0 /100 | #301 | Tragic 42.1% |
| Immigrants | Zaire | 0.0 /100 | #302 | Tragic 42.0% |