Cree vs Immigrants from Western Africa Female Unemployment
COMPARE
Cree
Immigrants from Western Africa
Female Unemployment
Female Unemployment Comparison
Cree
Immigrants from Western Africa
5.6%
FEMALE UNEMPLOYMENT
1.0/ 100
METRIC RATING
248th/ 347
METRIC RANK
5.9%
FEMALE UNEMPLOYMENT
0.0/ 100
METRIC RATING
269th/ 347
METRIC RANK
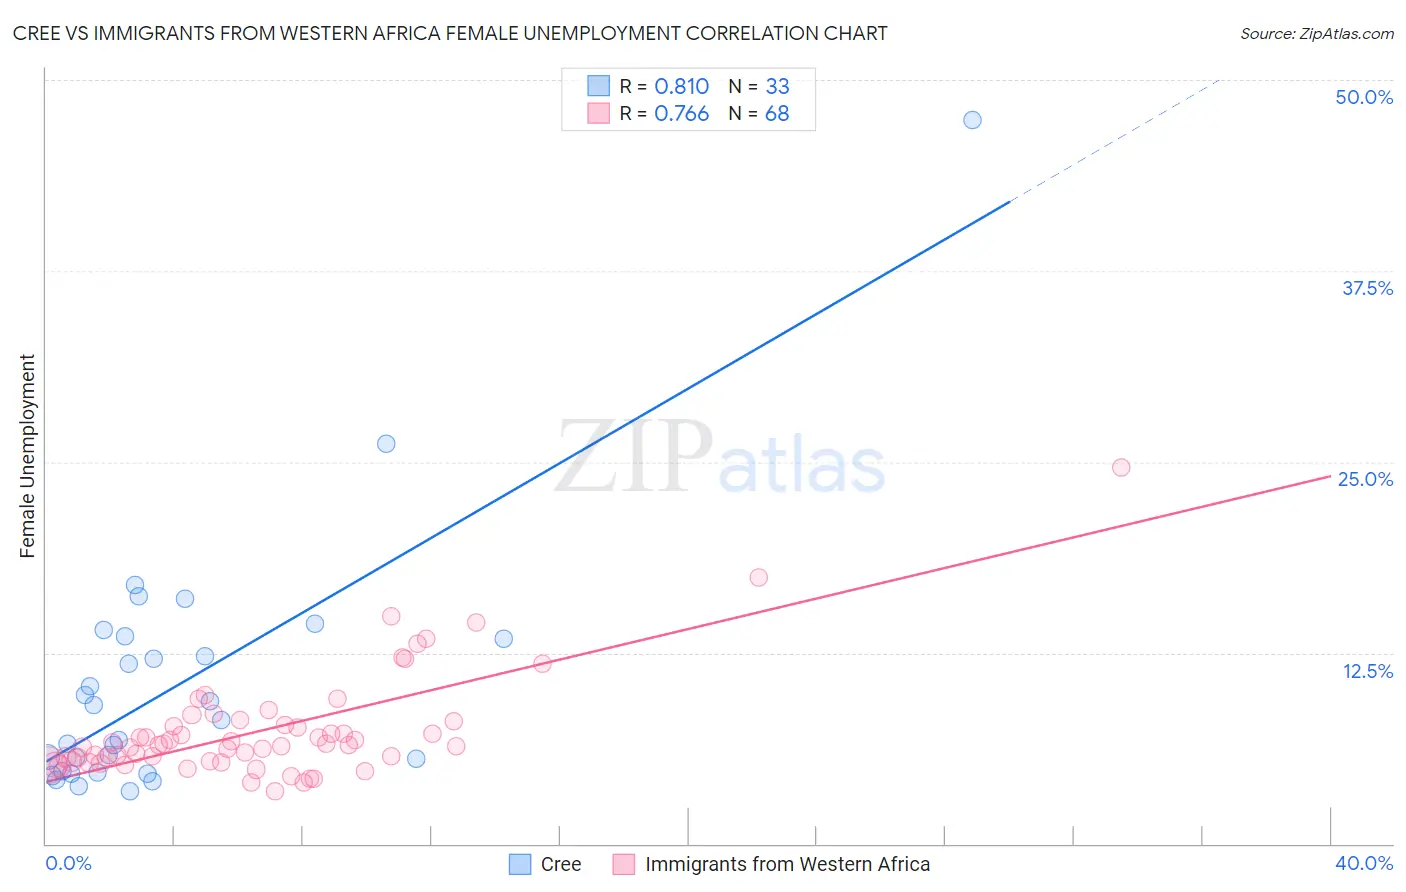
Cree vs Immigrants from Western Africa Female Unemployment Correlation Chart
The statistical analysis conducted on geographies consisting of 76,053,409 people shows a very strong positive correlation between the proportion of Cree and unemploymnet rate among females in the United States with a correlation coefficient (R) of 0.810 and weighted average of 5.6%. Similarly, the statistical analysis conducted on geographies consisting of 356,869,554 people shows a strong positive correlation between the proportion of Immigrants from Western Africa and unemploymnet rate among females in the United States with a correlation coefficient (R) of 0.766 and weighted average of 5.9%, a difference of 5.0%.
Female Unemployment Correlation Summary
| Measurement | Cree | Immigrants from Western Africa |
| Minimum | 3.4% | 3.4% |
| Maximum | 47.4% | 24.6% |
| Range | 44.0% | 21.2% |
| Mean | 10.4% | 7.4% |
| Median | 8.1% | 6.5% |
| Interquartile 25% (IQ1) | 4.7% | 5.4% |
| Interquartile 75% (IQ3) | 13.5% | 7.9% |
| Interquartile Range (IQR) | 8.8% | 2.5% |
| Standard Deviation (Sample) | 8.4% | 3.5% |
| Standard Deviation (Population) | 8.3% | 3.5% |
Similar Demographics by Female Unemployment
Demographics Similar to Cree by Female Unemployment
In terms of female unemployment, the demographic groups most similar to Cree are Immigrants from Uzbekistan (5.6%, a difference of 0.040%), Immigrants from Western Asia (5.6%, a difference of 0.16%), Japanese (5.6%, a difference of 0.24%), Immigrants from Syria (5.6%, a difference of 0.33%), and Assyrian/Chaldean/Syriac (5.6%, a difference of 0.39%).
| Demographics | Rating | Rank | Female Unemployment |
| South American Indians | 2.8 /100 | #241 | Tragic 5.5% |
| Marshallese | 2.3 /100 | #242 | Tragic 5.6% |
| Spanish Americans | 2.2 /100 | #243 | Tragic 5.6% |
| Immigrants | Liberia | 1.5 /100 | #244 | Tragic 5.6% |
| Guamanians/Chamorros | 1.4 /100 | #245 | Tragic 5.6% |
| Japanese | 1.2 /100 | #246 | Tragic 5.6% |
| Immigrants | Western Asia | 1.1 /100 | #247 | Tragic 5.6% |
| Cree | 1.0 /100 | #248 | Tragic 5.6% |
| Immigrants | Uzbekistan | 1.0 /100 | #249 | Tragic 5.6% |
| Immigrants | Syria | 0.8 /100 | #250 | Tragic 5.6% |
| Assyrians/Chaldeans/Syriacs | 0.8 /100 | #251 | Tragic 5.6% |
| Cajuns | 0.7 /100 | #252 | Tragic 5.7% |
| Immigrants | Sierra Leone | 0.6 /100 | #253 | Tragic 5.7% |
| Immigrants | Immigrants | 0.6 /100 | #254 | Tragic 5.7% |
| Immigrants | Cameroon | 0.6 /100 | #255 | Tragic 5.7% |
Demographics Similar to Immigrants from Western Africa by Female Unemployment
In terms of female unemployment, the demographic groups most similar to Immigrants from Western Africa are Honduran (5.9%, a difference of 0.20%), Nepalese (5.9%, a difference of 0.30%), Cape Verdean (5.9%, a difference of 0.40%), Immigrants from Honduras (5.9%, a difference of 0.41%), and Central American (5.9%, a difference of 0.51%).
| Demographics | Rating | Rank | Female Unemployment |
| Immigrants | Nigeria | 0.1 /100 | #262 | Tragic 5.8% |
| Immigrants | Azores | 0.1 /100 | #263 | Tragic 5.8% |
| Immigrants | Bahamas | 0.1 /100 | #264 | Tragic 5.8% |
| Blackfeet | 0.0 /100 | #265 | Tragic 5.9% |
| Cape Verdeans | 0.0 /100 | #266 | Tragic 5.9% |
| Nepalese | 0.0 /100 | #267 | Tragic 5.9% |
| Hondurans | 0.0 /100 | #268 | Tragic 5.9% |
| Immigrants | Western Africa | 0.0 /100 | #269 | Tragic 5.9% |
| Immigrants | Honduras | 0.0 /100 | #270 | Tragic 5.9% |
| Central Americans | 0.0 /100 | #271 | Tragic 5.9% |
| Lumbee | 0.0 /100 | #272 | Tragic 5.9% |
| Ghanaians | 0.0 /100 | #273 | Tragic 5.9% |
| Africans | 0.0 /100 | #274 | Tragic 5.9% |
| Senegalese | 0.0 /100 | #275 | Tragic 6.0% |
| Bahamians | 0.0 /100 | #276 | Tragic 6.0% |