Immigrants from North America vs Immigrants from Western Africa Births to Unmarried Women
COMPARE
Immigrants from North America
Immigrants from Western Africa
Births to Unmarried Women
Births to Unmarried Women Comparison
Immigrants from North America
Immigrants from Western Africa
30.6%
BIRTHS TO UNMARRIED WOMEN
81.5/ 100
METRIC RATING
145th/ 347
METRIC RANK
36.0%
BIRTHS TO UNMARRIED WOMEN
0.3/ 100
METRIC RATING
251st/ 347
METRIC RANK
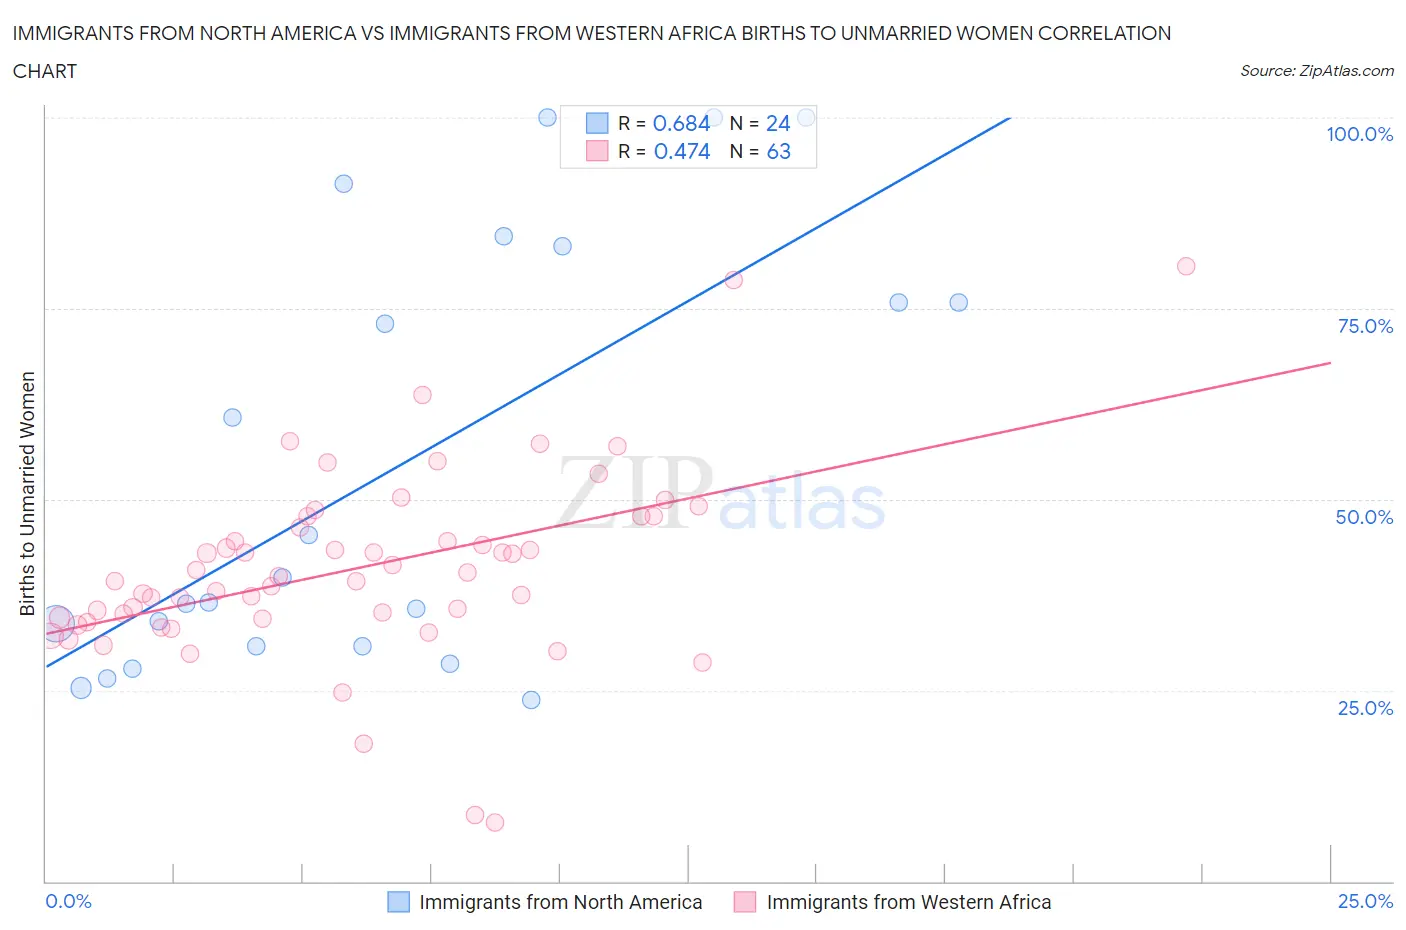
Immigrants from North America vs Immigrants from Western Africa Births to Unmarried Women Correlation Chart
The statistical analysis conducted on geographies consisting of 422,623,655 people shows a significant positive correlation between the proportion of Immigrants from North America and percentage of births to unmarried women in the United States with a correlation coefficient (R) of 0.684 and weighted average of 30.6%. Similarly, the statistical analysis conducted on geographies consisting of 339,836,557 people shows a moderate positive correlation between the proportion of Immigrants from Western Africa and percentage of births to unmarried women in the United States with a correlation coefficient (R) of 0.474 and weighted average of 36.0%, a difference of 17.6%.
Births to Unmarried Women Correlation Summary
| Measurement | Immigrants from North America | Immigrants from Western Africa |
| Minimum | 23.8% | 7.8% |
| Maximum | 100.0% | 80.6% |
| Range | 76.2% | 72.8% |
| Mean | 54.1% | 41.0% |
| Median | 38.1% | 39.9% |
| Interquartile 25% (IQ1) | 30.8% | 34.3% |
| Interquartile 75% (IQ3) | 79.4% | 47.8% |
| Interquartile Range (IQR) | 48.7% | 13.5% |
| Standard Deviation (Sample) | 27.8% | 12.4% |
| Standard Deviation (Population) | 27.2% | 12.3% |
Similar Demographics by Births to Unmarried Women
Demographics Similar to Immigrants from North America by Births to Unmarried Women
In terms of births to unmarried women, the demographic groups most similar to Immigrants from North America are Northern European (30.6%, a difference of 0.030%), Immigrants from Oceania (30.6%, a difference of 0.050%), Czech (30.5%, a difference of 0.10%), Immigrants from Uganda (30.5%, a difference of 0.17%), and South African (30.5%, a difference of 0.19%).
| Demographics | Rating | Rank | Births to Unmarried Women |
| Puget Sound Salish | 83.9 /100 | #138 | Excellent 30.4% |
| Immigrants | Canada | 83.7 /100 | #139 | Excellent 30.4% |
| Swiss | 83.1 /100 | #140 | Excellent 30.5% |
| Pakistanis | 83.0 /100 | #141 | Excellent 30.5% |
| South Africans | 82.7 /100 | #142 | Excellent 30.5% |
| Immigrants | Uganda | 82.6 /100 | #143 | Excellent 30.5% |
| Czechs | 82.1 /100 | #144 | Excellent 30.5% |
| Immigrants | North America | 81.5 /100 | #145 | Excellent 30.6% |
| Northern Europeans | 81.4 /100 | #146 | Excellent 30.6% |
| Immigrants | Oceania | 81.2 /100 | #147 | Excellent 30.6% |
| Chileans | 79.1 /100 | #148 | Good 30.7% |
| Serbians | 78.8 /100 | #149 | Good 30.7% |
| Somalis | 77.8 /100 | #150 | Good 30.7% |
| Italians | 77.0 /100 | #151 | Good 30.8% |
| Poles | 76.2 /100 | #152 | Good 30.8% |
Demographics Similar to Immigrants from Western Africa by Births to Unmarried Women
In terms of births to unmarried women, the demographic groups most similar to Immigrants from Western Africa are Salvadoran (36.0%, a difference of 0.12%), Mexican American Indian (35.7%, a difference of 0.57%), Immigrants from Portugal (36.2%, a difference of 0.58%), Potawatomi (36.2%, a difference of 0.81%), and Chickasaw (36.3%, a difference of 0.95%).
| Demographics | Rating | Rank | Births to Unmarried Women |
| Guyanese | 0.9 /100 | #244 | Tragic 35.2% |
| Shoshone | 0.8 /100 | #245 | Tragic 35.3% |
| Nigerians | 0.7 /100 | #246 | Tragic 35.3% |
| Immigrants | Nigeria | 0.7 /100 | #247 | Tragic 35.4% |
| Immigrants | Nonimmigrants | 0.6 /100 | #248 | Tragic 35.5% |
| Bermudans | 0.6 /100 | #249 | Tragic 35.5% |
| Mexican American Indians | 0.4 /100 | #250 | Tragic 35.7% |
| Immigrants | Western Africa | 0.3 /100 | #251 | Tragic 36.0% |
| Salvadorans | 0.3 /100 | #252 | Tragic 36.0% |
| Immigrants | Portugal | 0.2 /100 | #253 | Tragic 36.2% |
| Potawatomi | 0.2 /100 | #254 | Tragic 36.2% |
| Chickasaw | 0.2 /100 | #255 | Tragic 36.3% |
| Immigrants | Trinidad and Tobago | 0.2 /100 | #256 | Tragic 36.3% |
| Immigrants | Grenada | 0.2 /100 | #257 | Tragic 36.3% |
| Americans | 0.2 /100 | #258 | Tragic 36.4% |