Mongolian vs Immigrants from Western Africa Births to Unmarried Women
COMPARE
Mongolian
Immigrants from Western Africa
Births to Unmarried Women
Births to Unmarried Women Comparison
Mongolians
Immigrants from Western Africa
27.9%
BIRTHS TO UNMARRIED WOMEN
99.3/ 100
METRIC RATING
55th/ 347
METRIC RANK
36.0%
BIRTHS TO UNMARRIED WOMEN
0.3/ 100
METRIC RATING
251st/ 347
METRIC RANK
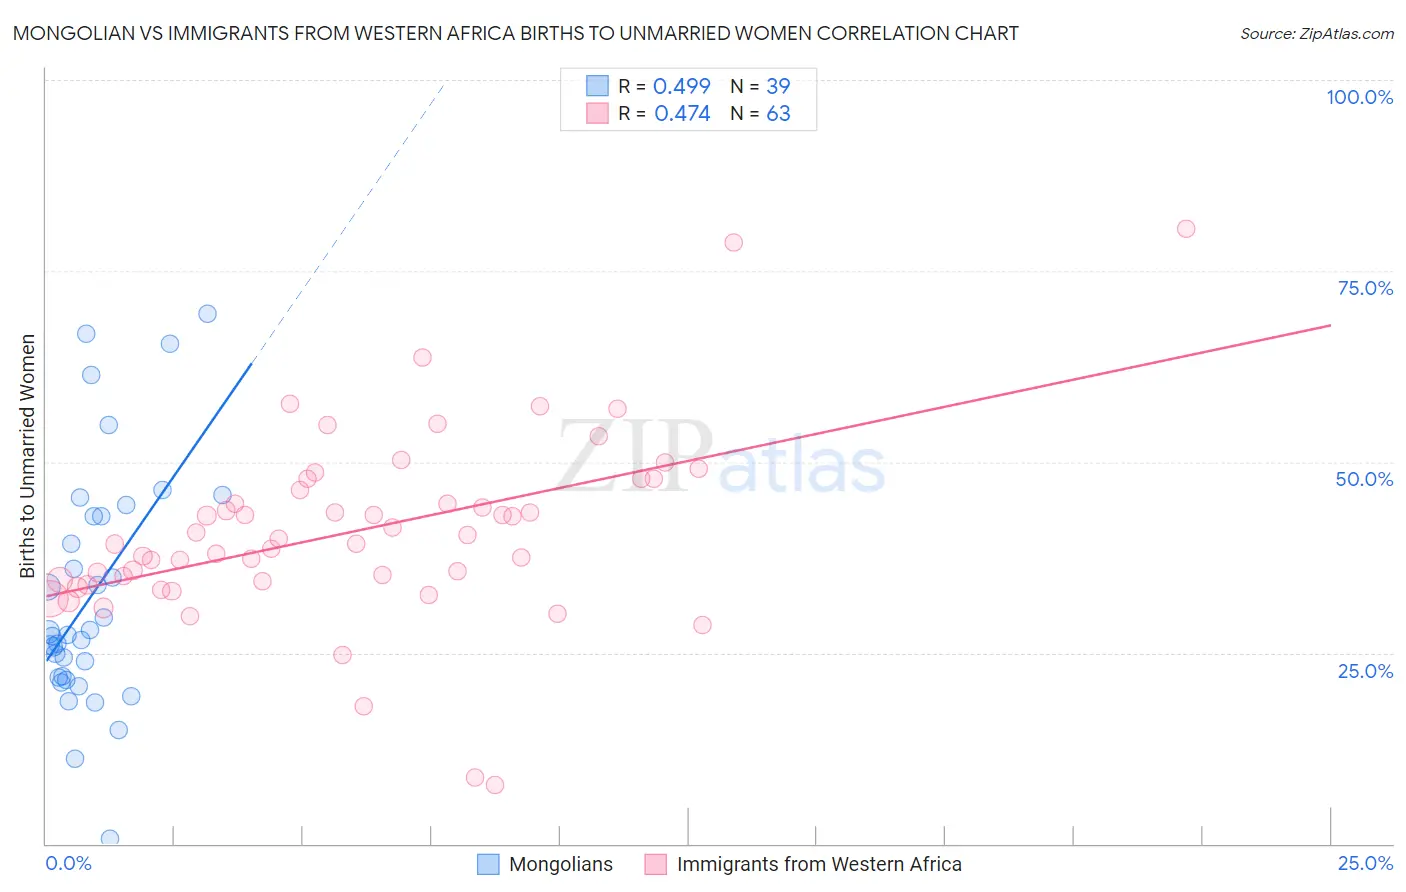
Mongolian vs Immigrants from Western Africa Births to Unmarried Women Correlation Chart
The statistical analysis conducted on geographies consisting of 135,823,191 people shows a moderate positive correlation between the proportion of Mongolians and percentage of births to unmarried women in the United States with a correlation coefficient (R) of 0.499 and weighted average of 27.9%. Similarly, the statistical analysis conducted on geographies consisting of 339,836,557 people shows a moderate positive correlation between the proportion of Immigrants from Western Africa and percentage of births to unmarried women in the United States with a correlation coefficient (R) of 0.474 and weighted average of 36.0%, a difference of 28.8%.
Births to Unmarried Women Correlation Summary
| Measurement | Mongolian | Immigrants from Western Africa |
| Minimum | 0.60% | 7.8% |
| Maximum | 69.4% | 80.6% |
| Range | 68.8% | 72.8% |
| Mean | 32.6% | 41.0% |
| Median | 27.3% | 39.9% |
| Interquartile 25% (IQ1) | 21.7% | 34.3% |
| Interquartile 75% (IQ3) | 42.9% | 47.8% |
| Interquartile Range (IQR) | 21.2% | 13.5% |
| Standard Deviation (Sample) | 15.7% | 12.4% |
| Standard Deviation (Population) | 15.5% | 12.3% |
Similar Demographics by Births to Unmarried Women
Demographics Similar to Mongolians by Births to Unmarried Women
In terms of births to unmarried women, the demographic groups most similar to Mongolians are Afghan (27.9%, a difference of 0.040%), Immigrants from Romania (27.9%, a difference of 0.11%), Bhutanese (27.9%, a difference of 0.12%), Macedonian (27.9%, a difference of 0.16%), and Immigrants from Belgium (28.0%, a difference of 0.26%).
| Demographics | Rating | Rank | Births to Unmarried Women |
| Eastern Europeans | 99.5 /100 | #48 | Exceptional 27.7% |
| Immigrants | Greece | 99.4 /100 | #49 | Exceptional 27.8% |
| Maltese | 99.4 /100 | #50 | Exceptional 27.8% |
| Macedonians | 99.4 /100 | #51 | Exceptional 27.9% |
| Bhutanese | 99.4 /100 | #52 | Exceptional 27.9% |
| Immigrants | Romania | 99.4 /100 | #53 | Exceptional 27.9% |
| Afghans | 99.4 /100 | #54 | Exceptional 27.9% |
| Mongolians | 99.3 /100 | #55 | Exceptional 27.9% |
| Immigrants | Belgium | 99.3 /100 | #56 | Exceptional 28.0% |
| Russians | 99.2 /100 | #57 | Exceptional 28.0% |
| Immigrants | Albania | 99.2 /100 | #58 | Exceptional 28.0% |
| Immigrants | Kazakhstan | 99.1 /100 | #59 | Exceptional 28.1% |
| Immigrants | Turkey | 99.1 /100 | #60 | Exceptional 28.1% |
| Immigrants | North Macedonia | 99.1 /100 | #61 | Exceptional 28.1% |
| Egyptians | 99.0 /100 | #62 | Exceptional 28.2% |
Demographics Similar to Immigrants from Western Africa by Births to Unmarried Women
In terms of births to unmarried women, the demographic groups most similar to Immigrants from Western Africa are Salvadoran (36.0%, a difference of 0.12%), Mexican American Indian (35.7%, a difference of 0.57%), Immigrants from Portugal (36.2%, a difference of 0.58%), Potawatomi (36.2%, a difference of 0.81%), and Chickasaw (36.3%, a difference of 0.95%).
| Demographics | Rating | Rank | Births to Unmarried Women |
| Guyanese | 0.9 /100 | #244 | Tragic 35.2% |
| Shoshone | 0.8 /100 | #245 | Tragic 35.3% |
| Nigerians | 0.7 /100 | #246 | Tragic 35.3% |
| Immigrants | Nigeria | 0.7 /100 | #247 | Tragic 35.4% |
| Immigrants | Nonimmigrants | 0.6 /100 | #248 | Tragic 35.5% |
| Bermudans | 0.6 /100 | #249 | Tragic 35.5% |
| Mexican American Indians | 0.4 /100 | #250 | Tragic 35.7% |
| Immigrants | Western Africa | 0.3 /100 | #251 | Tragic 36.0% |
| Salvadorans | 0.3 /100 | #252 | Tragic 36.0% |
| Immigrants | Portugal | 0.2 /100 | #253 | Tragic 36.2% |
| Potawatomi | 0.2 /100 | #254 | Tragic 36.2% |
| Chickasaw | 0.2 /100 | #255 | Tragic 36.3% |
| Immigrants | Trinidad and Tobago | 0.2 /100 | #256 | Tragic 36.3% |
| Immigrants | Grenada | 0.2 /100 | #257 | Tragic 36.3% |
| Americans | 0.2 /100 | #258 | Tragic 36.4% |