Immigrants from Argentina vs Immigrants from Western Africa Births to Unmarried Women
COMPARE
Immigrants from Argentina
Immigrants from Western Africa
Births to Unmarried Women
Births to Unmarried Women Comparison
Immigrants from Argentina
Immigrants from Western Africa
30.1%
BIRTHS TO UNMARRIED WOMEN
88.7/ 100
METRIC RATING
122nd/ 347
METRIC RANK
36.0%
BIRTHS TO UNMARRIED WOMEN
0.3/ 100
METRIC RATING
251st/ 347
METRIC RANK
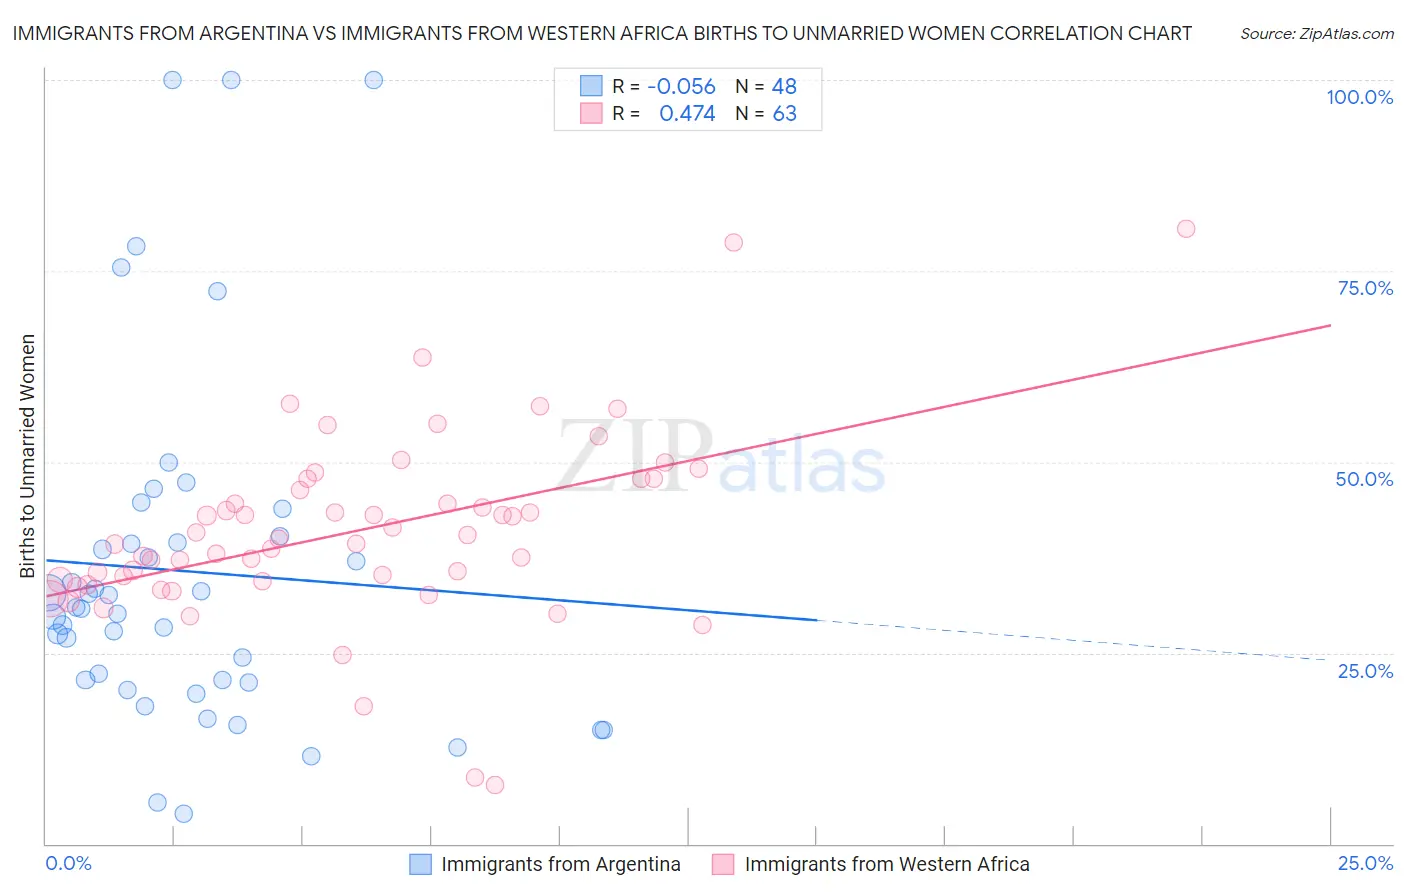
Immigrants from Argentina vs Immigrants from Western Africa Births to Unmarried Women Correlation Chart
The statistical analysis conducted on geographies consisting of 249,724,782 people shows a slight negative correlation between the proportion of Immigrants from Argentina and percentage of births to unmarried women in the United States with a correlation coefficient (R) of -0.056 and weighted average of 30.1%. Similarly, the statistical analysis conducted on geographies consisting of 339,836,557 people shows a moderate positive correlation between the proportion of Immigrants from Western Africa and percentage of births to unmarried women in the United States with a correlation coefficient (R) of 0.474 and weighted average of 36.0%, a difference of 19.3%.
Births to Unmarried Women Correlation Summary
| Measurement | Immigrants from Argentina | Immigrants from Western Africa |
| Minimum | 4.0% | 7.8% |
| Maximum | 100.0% | 80.6% |
| Range | 96.0% | 72.8% |
| Mean | 35.7% | 41.0% |
| Median | 30.9% | 39.9% |
| Interquartile 25% (IQ1) | 21.2% | 34.3% |
| Interquartile 75% (IQ3) | 39.8% | 47.8% |
| Interquartile Range (IQR) | 18.5% | 13.5% |
| Standard Deviation (Sample) | 22.9% | 12.4% |
| Standard Deviation (Population) | 22.7% | 12.3% |
Similar Demographics by Births to Unmarried Women
Demographics Similar to Immigrants from Argentina by Births to Unmarried Women
In terms of births to unmarried women, the demographic groups most similar to Immigrants from Argentina are Korean (30.1%, a difference of 0.050%), Ugandan (30.1%, a difference of 0.12%), Syrian (30.2%, a difference of 0.13%), Croatian (30.2%, a difference of 0.17%), and Vietnamese (30.2%, a difference of 0.24%).
| Demographics | Rating | Rank | Births to Unmarried Women |
| Ethiopians | 91.9 /100 | #115 | Exceptional 29.8% |
| Immigrants | Italy | 91.7 /100 | #116 | Exceptional 29.9% |
| Immigrants | Netherlands | 91.1 /100 | #117 | Exceptional 29.9% |
| Immigrants | Norway | 91.0 /100 | #118 | Exceptional 29.9% |
| Argentineans | 90.5 /100 | #119 | Exceptional 30.0% |
| Ugandans | 89.2 /100 | #120 | Excellent 30.1% |
| Koreans | 88.9 /100 | #121 | Excellent 30.1% |
| Immigrants | Argentina | 88.7 /100 | #122 | Excellent 30.1% |
| Syrians | 88.2 /100 | #123 | Excellent 30.2% |
| Croatians | 88.0 /100 | #124 | Excellent 30.2% |
| Vietnamese | 87.7 /100 | #125 | Excellent 30.2% |
| Europeans | 87.2 /100 | #126 | Excellent 30.2% |
| Chinese | 87.1 /100 | #127 | Excellent 30.2% |
| Icelanders | 86.0 /100 | #128 | Excellent 30.3% |
| Immigrants | Spain | 85.8 /100 | #129 | Excellent 30.3% |
Demographics Similar to Immigrants from Western Africa by Births to Unmarried Women
In terms of births to unmarried women, the demographic groups most similar to Immigrants from Western Africa are Salvadoran (36.0%, a difference of 0.12%), Mexican American Indian (35.7%, a difference of 0.57%), Immigrants from Portugal (36.2%, a difference of 0.58%), Potawatomi (36.2%, a difference of 0.81%), and Chickasaw (36.3%, a difference of 0.95%).
| Demographics | Rating | Rank | Births to Unmarried Women |
| Guyanese | 0.9 /100 | #244 | Tragic 35.2% |
| Shoshone | 0.8 /100 | #245 | Tragic 35.3% |
| Nigerians | 0.7 /100 | #246 | Tragic 35.3% |
| Immigrants | Nigeria | 0.7 /100 | #247 | Tragic 35.4% |
| Immigrants | Nonimmigrants | 0.6 /100 | #248 | Tragic 35.5% |
| Bermudans | 0.6 /100 | #249 | Tragic 35.5% |
| Mexican American Indians | 0.4 /100 | #250 | Tragic 35.7% |
| Immigrants | Western Africa | 0.3 /100 | #251 | Tragic 36.0% |
| Salvadorans | 0.3 /100 | #252 | Tragic 36.0% |
| Immigrants | Portugal | 0.2 /100 | #253 | Tragic 36.2% |
| Potawatomi | 0.2 /100 | #254 | Tragic 36.2% |
| Chickasaw | 0.2 /100 | #255 | Tragic 36.3% |
| Immigrants | Trinidad and Tobago | 0.2 /100 | #256 | Tragic 36.3% |
| Immigrants | Grenada | 0.2 /100 | #257 | Tragic 36.3% |
| Americans | 0.2 /100 | #258 | Tragic 36.4% |