Cree vs Mongolian Births to Unmarried Women
COMPARE
Cree
Mongolian
Births to Unmarried Women
Births to Unmarried Women Comparison
Cree
Mongolians
37.0%
BIRTHS TO UNMARRIED WOMEN
0.1/ 100
METRIC RATING
274th/ 347
METRIC RANK
27.9%
BIRTHS TO UNMARRIED WOMEN
99.3/ 100
METRIC RATING
55th/ 347
METRIC RANK
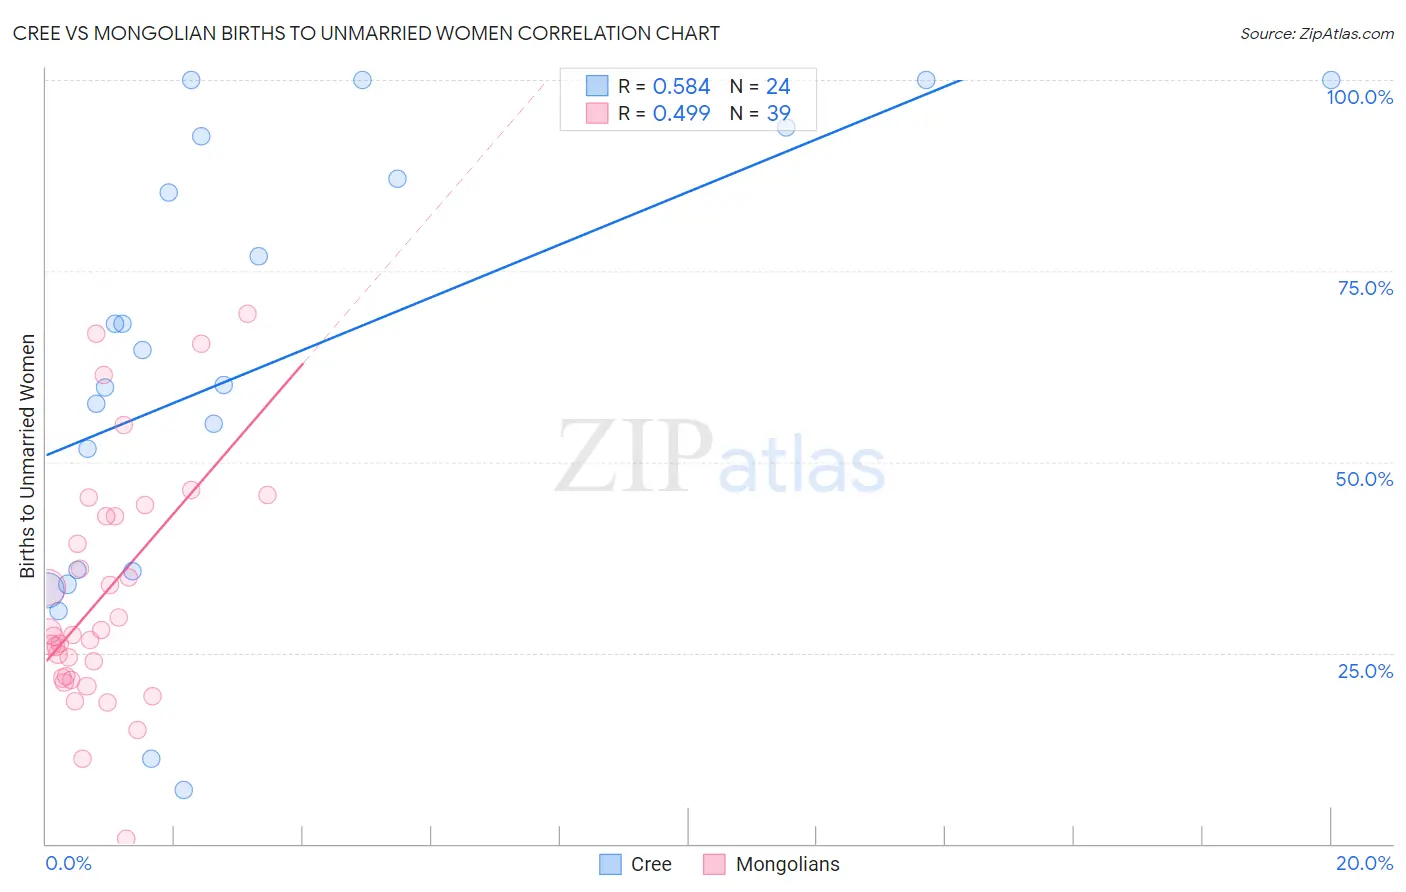
Cree vs Mongolian Births to Unmarried Women Correlation Chart
The statistical analysis conducted on geographies consisting of 74,807,025 people shows a substantial positive correlation between the proportion of Cree and percentage of births to unmarried women in the United States with a correlation coefficient (R) of 0.584 and weighted average of 37.0%. Similarly, the statistical analysis conducted on geographies consisting of 135,823,191 people shows a moderate positive correlation between the proportion of Mongolians and percentage of births to unmarried women in the United States with a correlation coefficient (R) of 0.499 and weighted average of 27.9%, a difference of 32.4%.
Births to Unmarried Women Correlation Summary
| Measurement | Cree | Mongolian |
| Minimum | 7.1% | 0.60% |
| Maximum | 100.0% | 69.4% |
| Range | 92.9% | 68.8% |
| Mean | 62.8% | 32.6% |
| Median | 62.3% | 27.3% |
| Interquartile 25% (IQ1) | 35.7% | 21.7% |
| Interquartile 75% (IQ3) | 89.8% | 42.9% |
| Interquartile Range (IQR) | 54.1% | 21.2% |
| Standard Deviation (Sample) | 28.7% | 15.7% |
| Standard Deviation (Population) | 28.1% | 15.5% |
Similar Demographics by Births to Unmarried Women
Demographics Similar to Cree by Births to Unmarried Women
In terms of births to unmarried women, the demographic groups most similar to Cree are Barbadian (37.0%, a difference of 0.030%), Mexican (36.9%, a difference of 0.090%), Choctaw (36.9%, a difference of 0.21%), Belizean (37.0%, a difference of 0.22%), and Immigrants from Barbados (36.8%, a difference of 0.43%).
| Demographics | Rating | Rank | Births to Unmarried Women |
| Central Americans | 0.1 /100 | #267 | Tragic 36.7% |
| Comanche | 0.1 /100 | #268 | Tragic 36.7% |
| Senegalese | 0.1 /100 | #269 | Tragic 36.8% |
| Immigrants | Congo | 0.1 /100 | #270 | Tragic 36.8% |
| Immigrants | Barbados | 0.1 /100 | #271 | Tragic 36.8% |
| Choctaw | 0.1 /100 | #272 | Tragic 36.9% |
| Mexicans | 0.1 /100 | #273 | Tragic 36.9% |
| Cree | 0.1 /100 | #274 | Tragic 37.0% |
| Barbadians | 0.1 /100 | #275 | Tragic 37.0% |
| Belizeans | 0.1 /100 | #276 | Tragic 37.0% |
| Guatemalans | 0.1 /100 | #277 | Tragic 37.1% |
| Immigrants | Latin America | 0.1 /100 | #278 | Tragic 37.1% |
| West Indians | 0.1 /100 | #279 | Tragic 37.3% |
| Immigrants | St. Vincent and the Grenadines | 0.1 /100 | #280 | Tragic 37.3% |
| Immigrants | Belize | 0.1 /100 | #281 | Tragic 37.3% |
Demographics Similar to Mongolians by Births to Unmarried Women
In terms of births to unmarried women, the demographic groups most similar to Mongolians are Afghan (27.9%, a difference of 0.040%), Immigrants from Romania (27.9%, a difference of 0.11%), Bhutanese (27.9%, a difference of 0.12%), Macedonian (27.9%, a difference of 0.16%), and Immigrants from Belgium (28.0%, a difference of 0.26%).
| Demographics | Rating | Rank | Births to Unmarried Women |
| Eastern Europeans | 99.5 /100 | #48 | Exceptional 27.7% |
| Immigrants | Greece | 99.4 /100 | #49 | Exceptional 27.8% |
| Maltese | 99.4 /100 | #50 | Exceptional 27.8% |
| Macedonians | 99.4 /100 | #51 | Exceptional 27.9% |
| Bhutanese | 99.4 /100 | #52 | Exceptional 27.9% |
| Immigrants | Romania | 99.4 /100 | #53 | Exceptional 27.9% |
| Afghans | 99.4 /100 | #54 | Exceptional 27.9% |
| Mongolians | 99.3 /100 | #55 | Exceptional 27.9% |
| Immigrants | Belgium | 99.3 /100 | #56 | Exceptional 28.0% |
| Russians | 99.2 /100 | #57 | Exceptional 28.0% |
| Immigrants | Albania | 99.2 /100 | #58 | Exceptional 28.0% |
| Immigrants | Kazakhstan | 99.1 /100 | #59 | Exceptional 28.1% |
| Immigrants | Turkey | 99.1 /100 | #60 | Exceptional 28.1% |
| Immigrants | North Macedonia | 99.1 /100 | #61 | Exceptional 28.1% |
| Egyptians | 99.0 /100 | #62 | Exceptional 28.2% |