Finnish vs Immigrants from Western Africa Births to Unmarried Women
COMPARE
Finnish
Immigrants from Western Africa
Births to Unmarried Women
Births to Unmarried Women Comparison
Finns
Immigrants from Western Africa
31.7%
BIRTHS TO UNMARRIED WOMEN
50.5/ 100
METRIC RATING
171st/ 347
METRIC RANK
36.0%
BIRTHS TO UNMARRIED WOMEN
0.3/ 100
METRIC RATING
251st/ 347
METRIC RANK
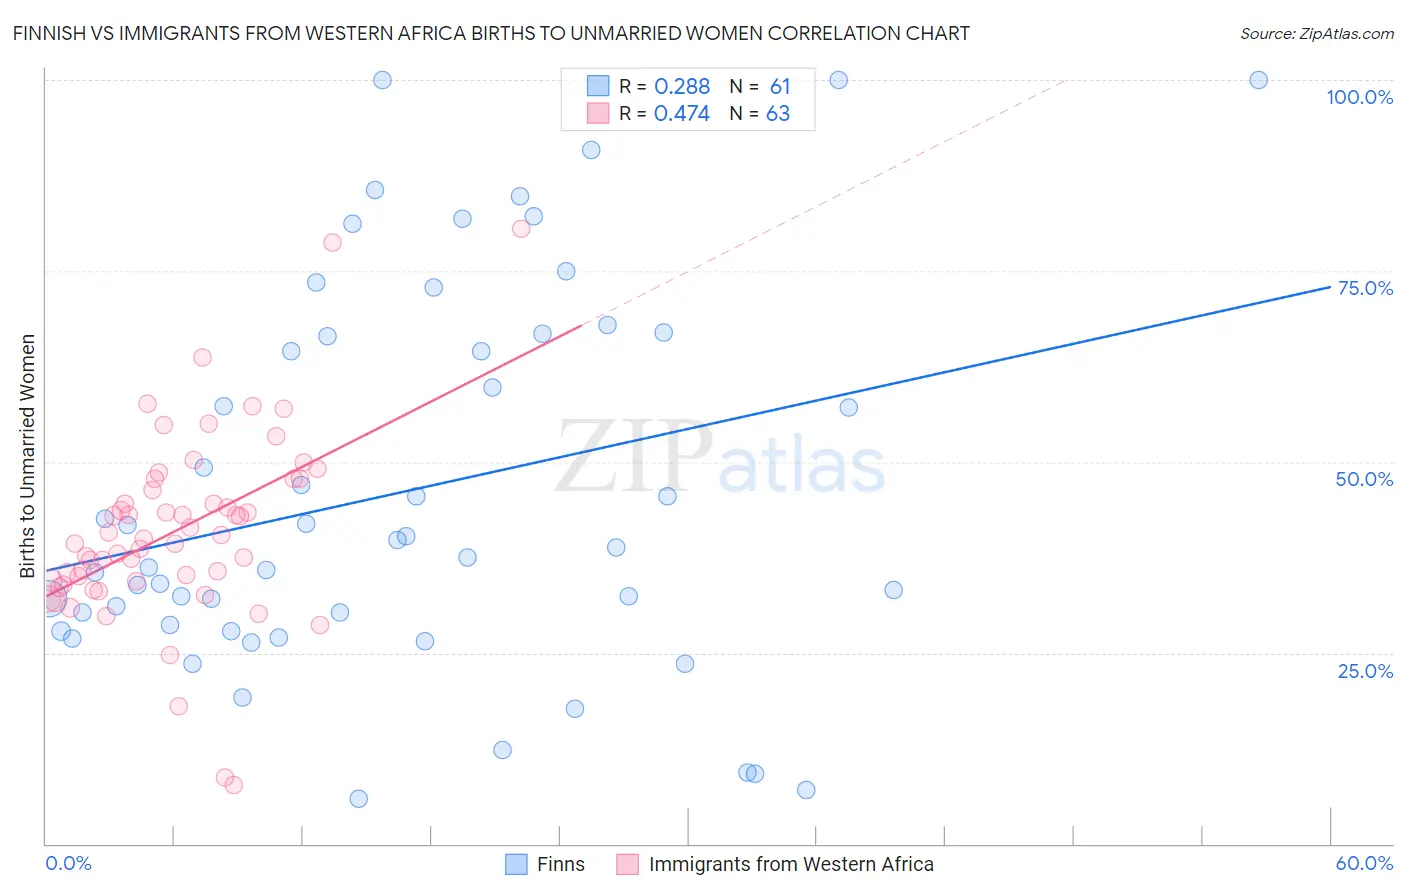
Finnish vs Immigrants from Western Africa Births to Unmarried Women Correlation Chart
The statistical analysis conducted on geographies consisting of 371,602,091 people shows a weak positive correlation between the proportion of Finns and percentage of births to unmarried women in the United States with a correlation coefficient (R) of 0.288 and weighted average of 31.7%. Similarly, the statistical analysis conducted on geographies consisting of 339,836,557 people shows a moderate positive correlation between the proportion of Immigrants from Western Africa and percentage of births to unmarried women in the United States with a correlation coefficient (R) of 0.474 and weighted average of 36.0%, a difference of 13.6%.
Births to Unmarried Women Correlation Summary
| Measurement | Finnish | Immigrants from Western Africa |
| Minimum | 5.8% | 7.8% |
| Maximum | 100.0% | 80.6% |
| Range | 94.2% | 72.8% |
| Mean | 46.2% | 41.0% |
| Median | 38.9% | 39.9% |
| Interquartile 25% (IQ1) | 28.2% | 34.3% |
| Interquartile 75% (IQ3) | 66.5% | 47.8% |
| Interquartile Range (IQR) | 38.3% | 13.5% |
| Standard Deviation (Sample) | 24.9% | 12.4% |
| Standard Deviation (Population) | 24.7% | 12.3% |
Similar Demographics by Births to Unmarried Women
Demographics Similar to Finns by Births to Unmarried Women
In terms of births to unmarried women, the demographic groups most similar to Finns are Immigrants from Eritrea (31.7%, a difference of 0.010%), Immigrants from Yemen (31.7%, a difference of 0.030%), Venezuelan (31.7%, a difference of 0.050%), Guamanian/Chamorro (31.6%, a difference of 0.080%), and Immigrants from Venezuela (31.7%, a difference of 0.12%).
| Demographics | Rating | Rank | Births to Unmarried Women |
| Hungarians | 64.1 /100 | #164 | Good 31.2% |
| Immigrants | Somalia | 58.1 /100 | #165 | Average 31.4% |
| Peruvians | 55.5 /100 | #166 | Average 31.5% |
| Dutch | 55.3 /100 | #167 | Average 31.5% |
| Belgians | 52.4 /100 | #168 | Average 31.6% |
| Slavs | 52.0 /100 | #169 | Average 31.6% |
| Guamanians/Chamorros | 51.3 /100 | #170 | Average 31.6% |
| Finns | 50.5 /100 | #171 | Average 31.7% |
| Immigrants | Eritrea | 50.4 /100 | #172 | Average 31.7% |
| Immigrants | Yemen | 50.2 /100 | #173 | Average 31.7% |
| Venezuelans | 50.0 /100 | #174 | Average 31.7% |
| Immigrants | Venezuela | 49.2 /100 | #175 | Average 31.7% |
| Scottish | 48.1 /100 | #176 | Average 31.7% |
| South American Indians | 47.7 /100 | #177 | Average 31.7% |
| English | 47.4 /100 | #178 | Average 31.7% |
Demographics Similar to Immigrants from Western Africa by Births to Unmarried Women
In terms of births to unmarried women, the demographic groups most similar to Immigrants from Western Africa are Salvadoran (36.0%, a difference of 0.12%), Mexican American Indian (35.7%, a difference of 0.57%), Immigrants from Portugal (36.2%, a difference of 0.58%), Potawatomi (36.2%, a difference of 0.81%), and Chickasaw (36.3%, a difference of 0.95%).
| Demographics | Rating | Rank | Births to Unmarried Women |
| Guyanese | 0.9 /100 | #244 | Tragic 35.2% |
| Shoshone | 0.8 /100 | #245 | Tragic 35.3% |
| Nigerians | 0.7 /100 | #246 | Tragic 35.3% |
| Immigrants | Nigeria | 0.7 /100 | #247 | Tragic 35.4% |
| Immigrants | Nonimmigrants | 0.6 /100 | #248 | Tragic 35.5% |
| Bermudans | 0.6 /100 | #249 | Tragic 35.5% |
| Mexican American Indians | 0.4 /100 | #250 | Tragic 35.7% |
| Immigrants | Western Africa | 0.3 /100 | #251 | Tragic 36.0% |
| Salvadorans | 0.3 /100 | #252 | Tragic 36.0% |
| Immigrants | Portugal | 0.2 /100 | #253 | Tragic 36.2% |
| Potawatomi | 0.2 /100 | #254 | Tragic 36.2% |
| Chickasaw | 0.2 /100 | #255 | Tragic 36.3% |
| Immigrants | Trinidad and Tobago | 0.2 /100 | #256 | Tragic 36.3% |
| Immigrants | Grenada | 0.2 /100 | #257 | Tragic 36.3% |
| Americans | 0.2 /100 | #258 | Tragic 36.4% |