Costa Rican vs Immigrants from Vietnam Currently Married
COMPARE
Costa Rican
Immigrants from Vietnam
Currently Married
Currently Married Comparison
Costa Ricans
Immigrants from Vietnam
46.5%
CURRENTLY MARRIED
43.7/ 100
METRIC RATING
180th/ 347
METRIC RANK
47.2%
CURRENTLY MARRIED
78.2/ 100
METRIC RATING
136th/ 347
METRIC RANK
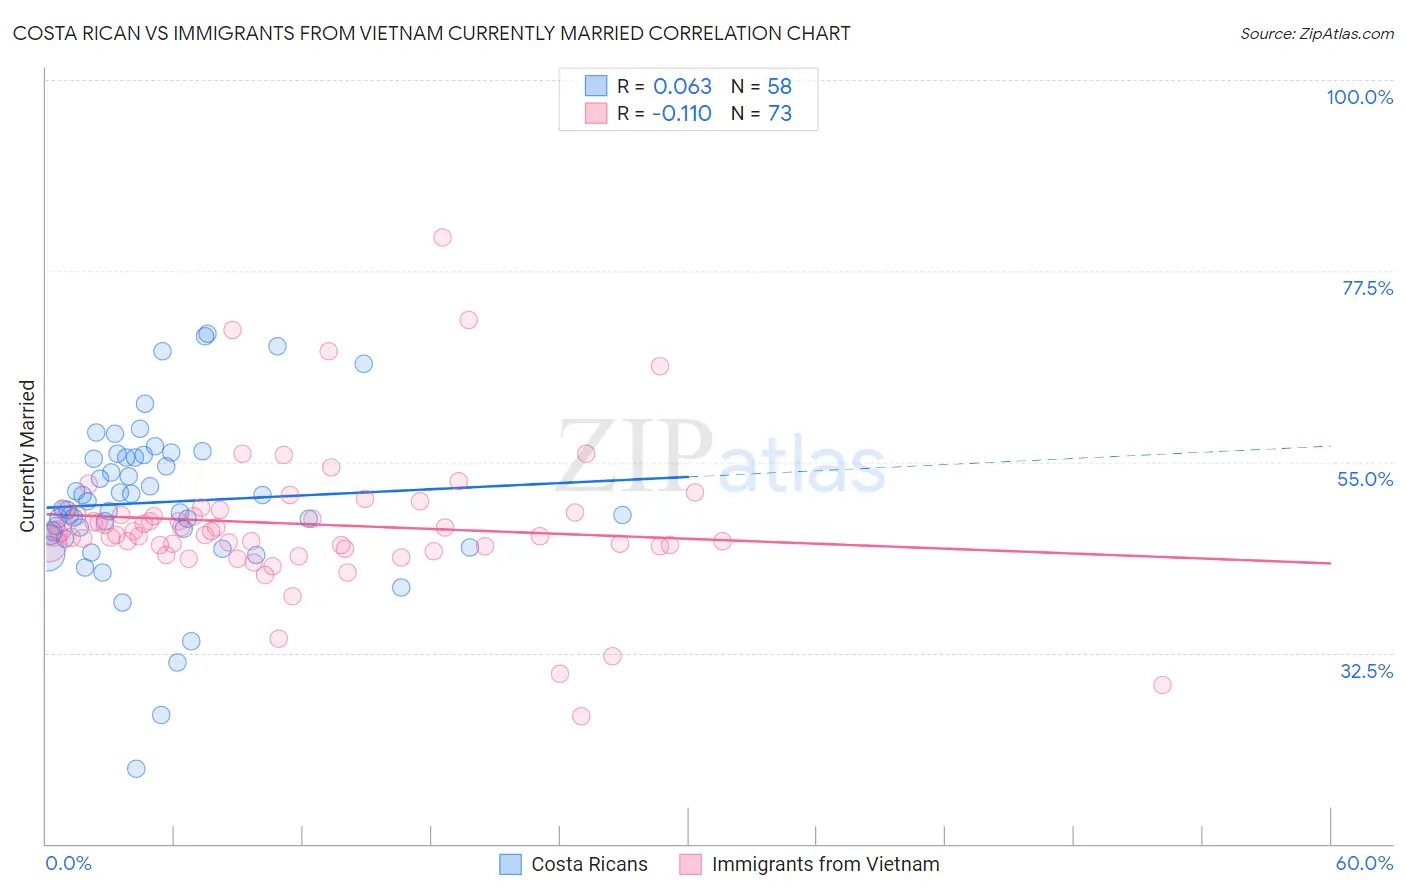
Costa Rican vs Immigrants from Vietnam Currently Married Correlation Chart
The statistical analysis conducted on geographies consisting of 253,590,013 people shows a slight positive correlation between the proportion of Costa Ricans and percentage of population currently married in the United States with a correlation coefficient (R) of 0.063 and weighted average of 46.5%. Similarly, the statistical analysis conducted on geographies consisting of 404,782,059 people shows a poor negative correlation between the proportion of Immigrants from Vietnam and percentage of population currently married in the United States with a correlation coefficient (R) of -0.110 and weighted average of 47.2%, a difference of 1.4%.
Currently Married Correlation Summary
| Measurement | Costa Rican | Immigrants from Vietnam |
| Minimum | 18.8% | 25.0% |
| Maximum | 70.1% | 81.5% |
| Range | 51.3% | 56.5% |
| Mean | 50.2% | 47.7% |
| Median | 49.4% | 46.5% |
| Interquartile 25% (IQ1) | 46.5% | 45.0% |
| Interquartile 75% (IQ3) | 55.6% | 49.2% |
| Interquartile Range (IQR) | 9.1% | 4.1% |
| Standard Deviation (Sample) | 9.6% | 8.6% |
| Standard Deviation (Population) | 9.5% | 8.5% |
Similar Demographics by Currently Married
Demographics Similar to Costa Ricans by Currently Married
In terms of currently married, the demographic groups most similar to Costa Ricans are Ottawa (46.5%, a difference of 0.020%), Immigrants from Oceania (46.5%, a difference of 0.030%), Potawatomi (46.5%, a difference of 0.070%), Chickasaw (46.6%, a difference of 0.15%), and Immigrants from Northern Africa (46.5%, a difference of 0.15%).
| Demographics | Rating | Rank | Currently Married |
| Tlingit-Haida | 51.2 /100 | #173 | Average 46.7% |
| Peruvians | 50.0 /100 | #174 | Average 46.6% |
| Immigrants | Brazil | 49.9 /100 | #175 | Average 46.6% |
| Hawaiians | 48.6 /100 | #176 | Average 46.6% |
| Israelis | 48.6 /100 | #177 | Average 46.6% |
| Chickasaw | 47.8 /100 | #178 | Average 46.6% |
| Immigrants | Oceania | 44.6 /100 | #179 | Average 46.5% |
| Costa Ricans | 43.7 /100 | #180 | Average 46.5% |
| Ottawa | 43.0 /100 | #181 | Average 46.5% |
| Potawatomi | 41.9 /100 | #182 | Average 46.5% |
| Immigrants | Northern Africa | 39.7 /100 | #183 | Fair 46.5% |
| Brazilians | 39.3 /100 | #184 | Fair 46.4% |
| Mongolians | 37.6 /100 | #185 | Fair 46.4% |
| Immigrants | Chile | 36.8 /100 | #186 | Fair 46.4% |
| Immigrants | Peru | 35.3 /100 | #187 | Fair 46.4% |
Demographics Similar to Immigrants from Vietnam by Currently Married
In terms of currently married, the demographic groups most similar to Immigrants from Vietnam are Paraguayan (47.2%, a difference of 0.020%), Pakistani (47.2%, a difference of 0.040%), Yugoslavian (47.2%, a difference of 0.040%), Immigrants from Norway (47.2%, a difference of 0.080%), and Cajun (47.1%, a difference of 0.15%).
| Demographics | Rating | Rank | Currently Married |
| Sri Lankans | 83.2 /100 | #129 | Excellent 47.3% |
| Immigrants | Iraq | 82.8 /100 | #130 | Excellent 47.3% |
| Icelanders | 82.4 /100 | #131 | Excellent 47.3% |
| Afghans | 81.8 /100 | #132 | Excellent 47.3% |
| Immigrants | Malaysia | 81.1 /100 | #133 | Excellent 47.3% |
| Immigrants | Australia | 81.1 /100 | #134 | Excellent 47.3% |
| Immigrants | Norway | 79.7 /100 | #135 | Good 47.2% |
| Immigrants | Vietnam | 78.2 /100 | #136 | Good 47.2% |
| Paraguayans | 77.8 /100 | #137 | Good 47.2% |
| Pakistanis | 77.5 /100 | #138 | Good 47.2% |
| Yugoslavians | 77.4 /100 | #139 | Good 47.2% |
| Cajuns | 75.3 /100 | #140 | Good 47.1% |
| Venezuelans | 74.4 /100 | #141 | Good 47.1% |
| Argentineans | 74.4 /100 | #142 | Good 47.1% |
| Guamanians/Chamorros | 74.2 /100 | #143 | Good 47.1% |