Costa Rican vs Maltese Currently Married
COMPARE
Costa Rican
Maltese
Currently Married
Currently Married Comparison
Costa Ricans
Maltese
46.5%
CURRENTLY MARRIED
43.7/ 100
METRIC RATING
180th/ 347
METRIC RANK
49.0%
CURRENTLY MARRIED
99.6/ 100
METRIC RATING
25th/ 347
METRIC RANK
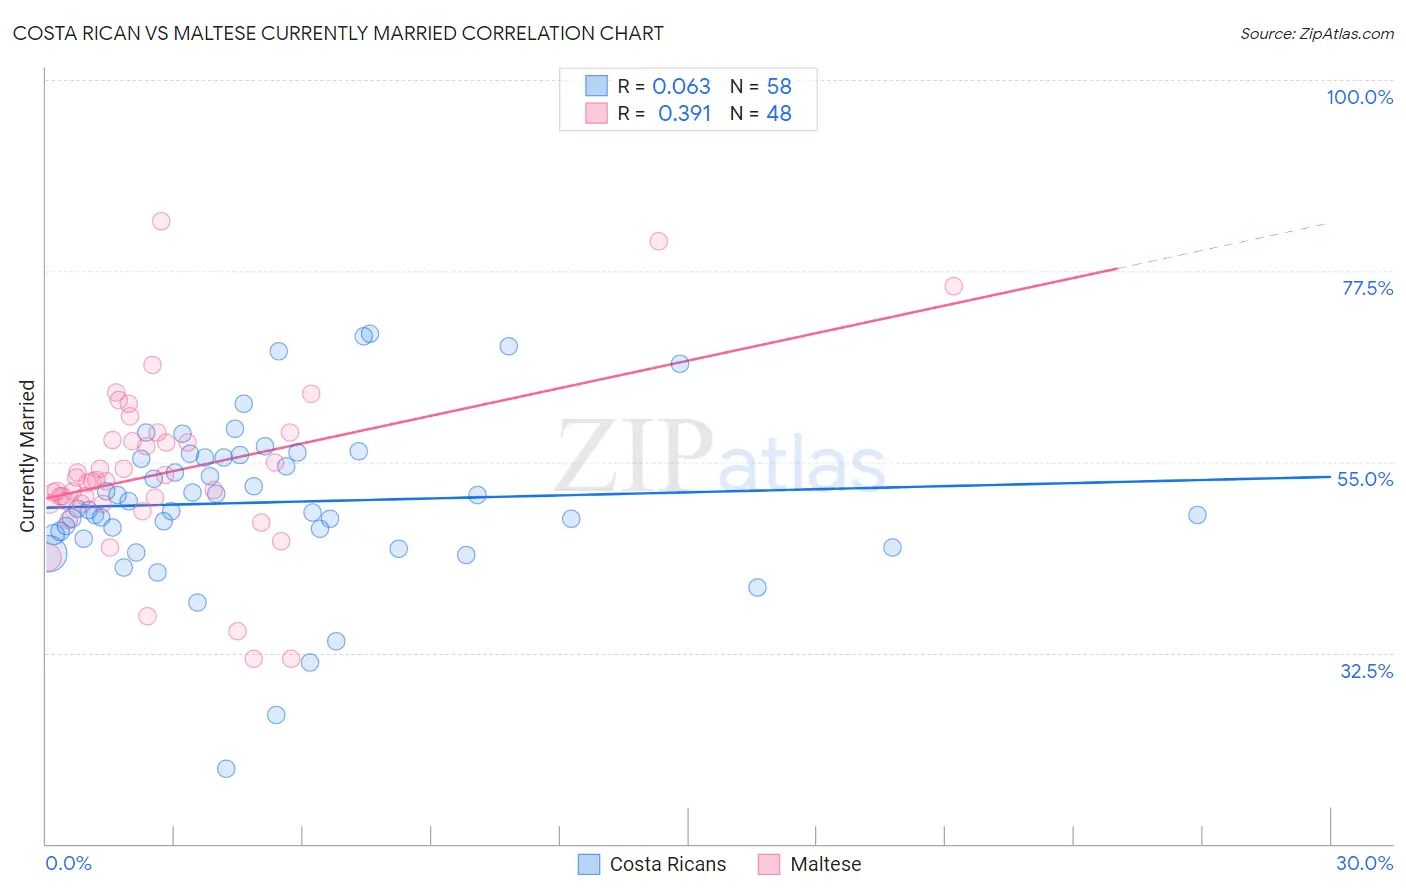
Costa Rican vs Maltese Currently Married Correlation Chart
The statistical analysis conducted on geographies consisting of 253,590,013 people shows a slight positive correlation between the proportion of Costa Ricans and percentage of population currently married in the United States with a correlation coefficient (R) of 0.063 and weighted average of 46.5%. Similarly, the statistical analysis conducted on geographies consisting of 126,466,050 people shows a mild positive correlation between the proportion of Maltese and percentage of population currently married in the United States with a correlation coefficient (R) of 0.391 and weighted average of 49.0%, a difference of 5.3%.
Currently Married Correlation Summary
| Measurement | Costa Rican | Maltese |
| Minimum | 18.8% | 31.8% |
| Maximum | 70.1% | 83.3% |
| Range | 51.3% | 51.5% |
| Mean | 50.2% | 53.8% |
| Median | 49.4% | 52.8% |
| Interquartile 25% (IQ1) | 46.5% | 50.0% |
| Interquartile 75% (IQ3) | 55.6% | 57.5% |
| Interquartile Range (IQR) | 9.1% | 7.5% |
| Standard Deviation (Sample) | 9.6% | 10.1% |
| Standard Deviation (Population) | 9.5% | 10.0% |
Similar Demographics by Currently Married
Demographics Similar to Costa Ricans by Currently Married
In terms of currently married, the demographic groups most similar to Costa Ricans are Ottawa (46.5%, a difference of 0.020%), Immigrants from Oceania (46.5%, a difference of 0.030%), Potawatomi (46.5%, a difference of 0.070%), Chickasaw (46.6%, a difference of 0.15%), and Immigrants from Northern Africa (46.5%, a difference of 0.15%).
| Demographics | Rating | Rank | Currently Married |
| Tlingit-Haida | 51.2 /100 | #173 | Average 46.7% |
| Peruvians | 50.0 /100 | #174 | Average 46.6% |
| Immigrants | Brazil | 49.9 /100 | #175 | Average 46.6% |
| Hawaiians | 48.6 /100 | #176 | Average 46.6% |
| Israelis | 48.6 /100 | #177 | Average 46.6% |
| Chickasaw | 47.8 /100 | #178 | Average 46.6% |
| Immigrants | Oceania | 44.6 /100 | #179 | Average 46.5% |
| Costa Ricans | 43.7 /100 | #180 | Average 46.5% |
| Ottawa | 43.0 /100 | #181 | Average 46.5% |
| Potawatomi | 41.9 /100 | #182 | Average 46.5% |
| Immigrants | Northern Africa | 39.7 /100 | #183 | Fair 46.5% |
| Brazilians | 39.3 /100 | #184 | Fair 46.4% |
| Mongolians | 37.6 /100 | #185 | Fair 46.4% |
| Immigrants | Chile | 36.8 /100 | #186 | Fair 46.4% |
| Immigrants | Peru | 35.3 /100 | #187 | Fair 46.4% |
Demographics Similar to Maltese by Currently Married
In terms of currently married, the demographic groups most similar to Maltese are Lithuanian (49.0%, a difference of 0.010%), Immigrants from Korea (49.0%, a difference of 0.050%), Immigrants from Pakistan (49.1%, a difference of 0.12%), Burmese (48.9%, a difference of 0.12%), and Welsh (48.9%, a difference of 0.16%).
| Demographics | Rating | Rank | Currently Married |
| Immigrants | Scotland | 99.8 /100 | #18 | Exceptional 49.3% |
| Europeans | 99.8 /100 | #19 | Exceptional 49.3% |
| Luxembourgers | 99.8 /100 | #20 | Exceptional 49.3% |
| Scottish | 99.8 /100 | #21 | Exceptional 49.2% |
| Bulgarians | 99.7 /100 | #22 | Exceptional 49.1% |
| Immigrants | Pakistan | 99.7 /100 | #23 | Exceptional 49.1% |
| Lithuanians | 99.6 /100 | #24 | Exceptional 49.0% |
| Maltese | 99.6 /100 | #25 | Exceptional 49.0% |
| Immigrants | Korea | 99.6 /100 | #26 | Exceptional 49.0% |
| Burmese | 99.6 /100 | #27 | Exceptional 48.9% |
| Welsh | 99.5 /100 | #28 | Exceptional 48.9% |
| Croatians | 99.5 /100 | #29 | Exceptional 48.9% |
| Eastern Europeans | 99.5 /100 | #30 | Exceptional 48.9% |
| Poles | 99.5 /100 | #31 | Exceptional 48.9% |
| Immigrants | Hong Kong | 99.5 /100 | #32 | Exceptional 48.9% |