Immigrants from Kazakhstan vs Maltese Currently Married
COMPARE
Immigrants from Kazakhstan
Maltese
Currently Married
Currently Married Comparison
Immigrants from Kazakhstan
Maltese
47.4%
CURRENTLY MARRIED
87.2/ 100
METRIC RATING
123rd/ 347
METRIC RANK
49.0%
CURRENTLY MARRIED
99.6/ 100
METRIC RATING
25th/ 347
METRIC RANK
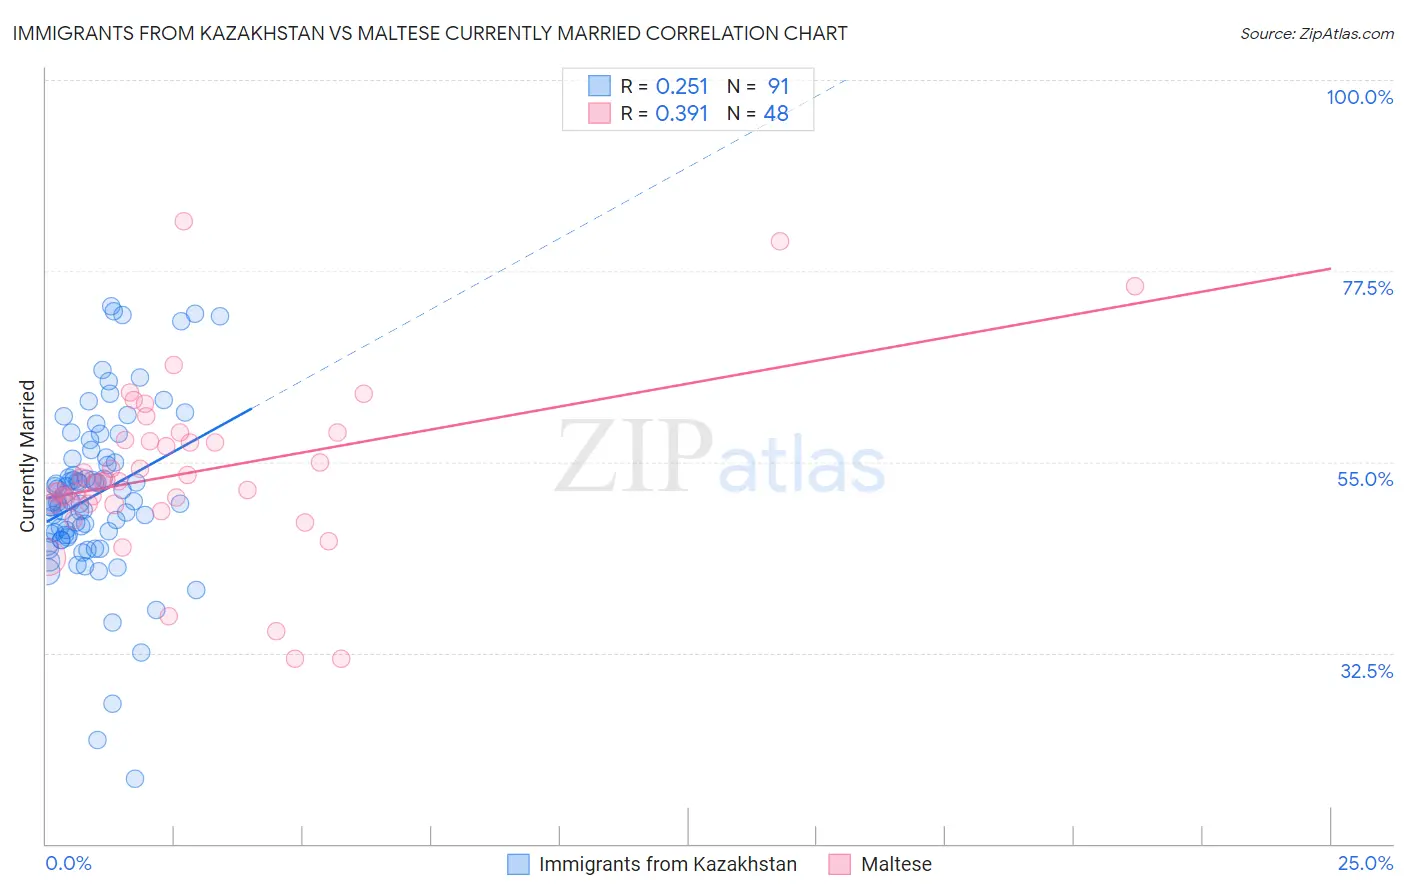
Immigrants from Kazakhstan vs Maltese Currently Married Correlation Chart
The statistical analysis conducted on geographies consisting of 124,441,390 people shows a weak positive correlation between the proportion of Immigrants from Kazakhstan and percentage of population currently married in the United States with a correlation coefficient (R) of 0.251 and weighted average of 47.4%. Similarly, the statistical analysis conducted on geographies consisting of 126,466,050 people shows a mild positive correlation between the proportion of Maltese and percentage of population currently married in the United States with a correlation coefficient (R) of 0.391 and weighted average of 49.0%, a difference of 3.3%.
Currently Married Correlation Summary
| Measurement | Immigrants from Kazakhstan | Maltese |
| Minimum | 17.6% | 31.8% |
| Maximum | 73.4% | 83.3% |
| Range | 55.8% | 51.5% |
| Mean | 51.1% | 53.8% |
| Median | 50.3% | 52.8% |
| Interquartile 25% (IQ1) | 46.3% | 50.0% |
| Interquartile 75% (IQ3) | 55.4% | 57.5% |
| Interquartile Range (IQR) | 9.1% | 7.5% |
| Standard Deviation (Sample) | 9.9% | 10.1% |
| Standard Deviation (Population) | 9.8% | 10.0% |
Similar Demographics by Currently Married
Demographics Similar to Immigrants from Kazakhstan by Currently Married
In terms of currently married, the demographic groups most similar to Immigrants from Kazakhstan are Laotian (47.4%, a difference of 0.050%), Osage (47.5%, a difference of 0.060%), Immigrants from Croatia (47.5%, a difference of 0.12%), Syrian (47.5%, a difference of 0.15%), and Okinawan (47.4%, a difference of 0.15%).
| Demographics | Rating | Rank | Currently Married |
| Palestinians | 90.4 /100 | #116 | Exceptional 47.6% |
| Puget Sound Salish | 90.3 /100 | #117 | Exceptional 47.6% |
| Immigrants | Philippines | 90.2 /100 | #118 | Exceptional 47.6% |
| Australians | 90.2 /100 | #119 | Exceptional 47.6% |
| Syrians | 88.9 /100 | #120 | Excellent 47.5% |
| Immigrants | Croatia | 88.6 /100 | #121 | Excellent 47.5% |
| Osage | 87.9 /100 | #122 | Excellent 47.5% |
| Immigrants | Kazakhstan | 87.2 /100 | #123 | Excellent 47.4% |
| Laotians | 86.6 /100 | #124 | Excellent 47.4% |
| Okinawans | 85.3 /100 | #125 | Excellent 47.4% |
| Immigrants | Jordan | 84.9 /100 | #126 | Excellent 47.4% |
| New Zealanders | 84.9 /100 | #127 | Excellent 47.4% |
| Portuguese | 84.2 /100 | #128 | Excellent 47.3% |
| Sri Lankans | 83.2 /100 | #129 | Excellent 47.3% |
| Immigrants | Iraq | 82.8 /100 | #130 | Excellent 47.3% |
Demographics Similar to Maltese by Currently Married
In terms of currently married, the demographic groups most similar to Maltese are Lithuanian (49.0%, a difference of 0.010%), Immigrants from Korea (49.0%, a difference of 0.050%), Immigrants from Pakistan (49.1%, a difference of 0.12%), Burmese (48.9%, a difference of 0.12%), and Welsh (48.9%, a difference of 0.16%).
| Demographics | Rating | Rank | Currently Married |
| Immigrants | Scotland | 99.8 /100 | #18 | Exceptional 49.3% |
| Europeans | 99.8 /100 | #19 | Exceptional 49.3% |
| Luxembourgers | 99.8 /100 | #20 | Exceptional 49.3% |
| Scottish | 99.8 /100 | #21 | Exceptional 49.2% |
| Bulgarians | 99.7 /100 | #22 | Exceptional 49.1% |
| Immigrants | Pakistan | 99.7 /100 | #23 | Exceptional 49.1% |
| Lithuanians | 99.6 /100 | #24 | Exceptional 49.0% |
| Maltese | 99.6 /100 | #25 | Exceptional 49.0% |
| Immigrants | Korea | 99.6 /100 | #26 | Exceptional 49.0% |
| Burmese | 99.6 /100 | #27 | Exceptional 48.9% |
| Welsh | 99.5 /100 | #28 | Exceptional 48.9% |
| Croatians | 99.5 /100 | #29 | Exceptional 48.9% |
| Eastern Europeans | 99.5 /100 | #30 | Exceptional 48.9% |
| Poles | 99.5 /100 | #31 | Exceptional 48.9% |
| Immigrants | Hong Kong | 99.5 /100 | #32 | Exceptional 48.9% |