Costa Rican vs Maltese Ambulatory Disability
COMPARE
Costa Rican
Maltese
Ambulatory Disability
Ambulatory Disability Comparison
Costa Ricans
Maltese
5.9%
AMBULATORY DISABILITY
92.6/ 100
METRIC RATING
121st/ 347
METRIC RANK
6.0%
AMBULATORY DISABILITY
81.6/ 100
METRIC RATING
150th/ 347
METRIC RANK
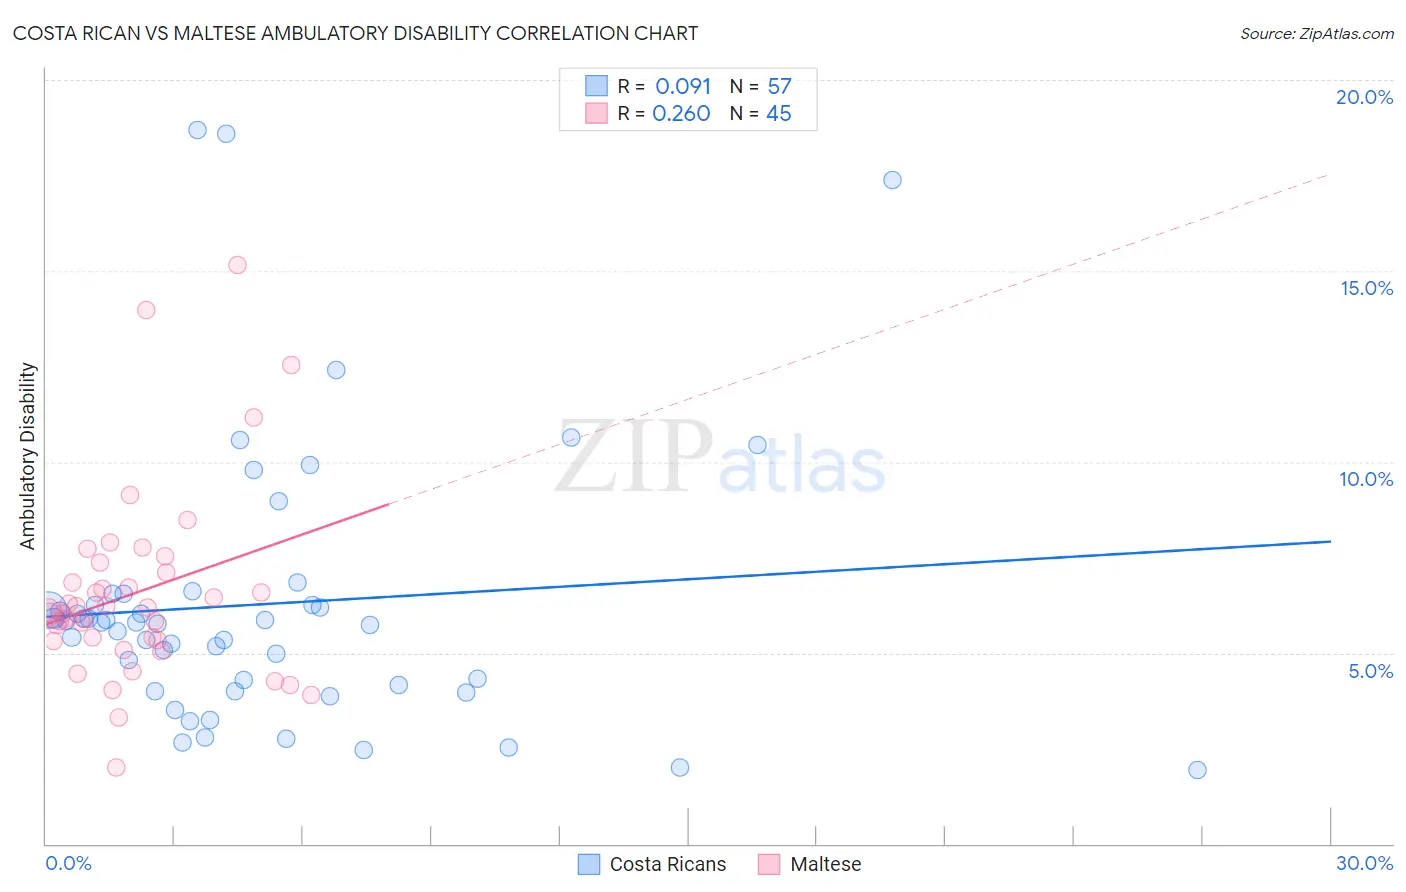
Costa Rican vs Maltese Ambulatory Disability Correlation Chart
The statistical analysis conducted on geographies consisting of 253,560,556 people shows a slight positive correlation between the proportion of Costa Ricans and percentage of population with ambulatory disability in the United States with a correlation coefficient (R) of 0.091 and weighted average of 5.9%. Similarly, the statistical analysis conducted on geographies consisting of 126,465,300 people shows a weak positive correlation between the proportion of Maltese and percentage of population with ambulatory disability in the United States with a correlation coefficient (R) of 0.260 and weighted average of 6.0%, a difference of 1.4%.
Ambulatory Disability Correlation Summary
| Measurement | Costa Rican | Maltese |
| Minimum | 1.9% | 2.0% |
| Maximum | 18.7% | 15.2% |
| Range | 16.8% | 13.2% |
| Mean | 6.3% | 6.6% |
| Median | 5.8% | 6.1% |
| Interquartile 25% (IQ1) | 4.1% | 5.3% |
| Interquartile 75% (IQ3) | 6.4% | 7.2% |
| Interquartile Range (IQR) | 2.3% | 1.9% |
| Standard Deviation (Sample) | 3.6% | 2.5% |
| Standard Deviation (Population) | 3.6% | 2.5% |
Similar Demographics by Ambulatory Disability
Demographics Similar to Costa Ricans by Ambulatory Disability
In terms of ambulatory disability, the demographic groups most similar to Costa Ricans are Icelander (5.9%, a difference of 0.0%), Immigrants from Russia (5.9%, a difference of 0.020%), Immigrants from Middle Africa (5.9%, a difference of 0.060%), Estonian (5.9%, a difference of 0.070%), and Norwegian (5.9%, a difference of 0.11%).
| Demographics | Rating | Rank | Ambulatory Disability |
| Immigrants | Poland | 95.4 /100 | #114 | Exceptional 5.9% |
| South American Indians | 94.8 /100 | #115 | Exceptional 5.9% |
| Immigrants | Africa | 94.7 /100 | #116 | Exceptional 5.9% |
| Immigrants | South Eastern Asia | 93.6 /100 | #117 | Exceptional 5.9% |
| Russians | 93.4 /100 | #118 | Exceptional 5.9% |
| Norwegians | 93.1 /100 | #119 | Exceptional 5.9% |
| Estonians | 92.9 /100 | #120 | Exceptional 5.9% |
| Costa Ricans | 92.6 /100 | #121 | Exceptional 5.9% |
| Icelanders | 92.6 /100 | #122 | Exceptional 5.9% |
| Immigrants | Russia | 92.4 /100 | #123 | Exceptional 5.9% |
| Immigrants | Middle Africa | 92.2 /100 | #124 | Exceptional 5.9% |
| Koreans | 91.6 /100 | #125 | Exceptional 5.9% |
| Arabs | 91.5 /100 | #126 | Exceptional 5.9% |
| Immigrants | Nigeria | 90.9 /100 | #127 | Exceptional 5.9% |
| Immigrants | Western Asia | 90.7 /100 | #128 | Exceptional 5.9% |
Demographics Similar to Maltese by Ambulatory Disability
In terms of ambulatory disability, the demographic groups most similar to Maltese are Lithuanian (6.0%, a difference of 0.020%), Immigrants from Eastern Europe (6.0%, a difference of 0.030%), Immigrants from Moldova (6.0%, a difference of 0.070%), Pakistani (6.0%, a difference of 0.080%), and Immigrants from Greece (6.0%, a difference of 0.080%).
| Demographics | Rating | Rank | Ambulatory Disability |
| Romanians | 82.9 /100 | #143 | Excellent 6.0% |
| Macedonians | 82.8 /100 | #144 | Excellent 6.0% |
| Pakistanis | 82.5 /100 | #145 | Excellent 6.0% |
| Immigrants | Greece | 82.5 /100 | #146 | Excellent 6.0% |
| Immigrants | Moldova | 82.4 /100 | #147 | Excellent 6.0% |
| Immigrants | Eastern Europe | 82.0 /100 | #148 | Excellent 6.0% |
| Lithuanians | 81.9 /100 | #149 | Excellent 6.0% |
| Maltese | 81.6 /100 | #150 | Excellent 6.0% |
| Greeks | 79.6 /100 | #151 | Good 6.0% |
| Immigrants | Austria | 78.8 /100 | #152 | Good 6.0% |
| Syrians | 75.5 /100 | #153 | Good 6.0% |
| Immigrants | Croatia | 75.1 /100 | #154 | Good 6.0% |
| Immigrants | Scotland | 72.1 /100 | #155 | Good 6.0% |
| Northern Europeans | 71.8 /100 | #156 | Good 6.0% |
| Ghanaians | 71.3 /100 | #157 | Good 6.0% |