Costa Rican vs Maltese 5th Grade
COMPARE
Costa Rican
Maltese
5th Grade
5th Grade Comparison
Costa Ricans
Maltese
97.1%
5TH GRADE
7.7/ 100
METRIC RATING
214th/ 347
METRIC RANK
98.0%
5TH GRADE
99.8/ 100
METRIC RATING
52nd/ 347
METRIC RANK
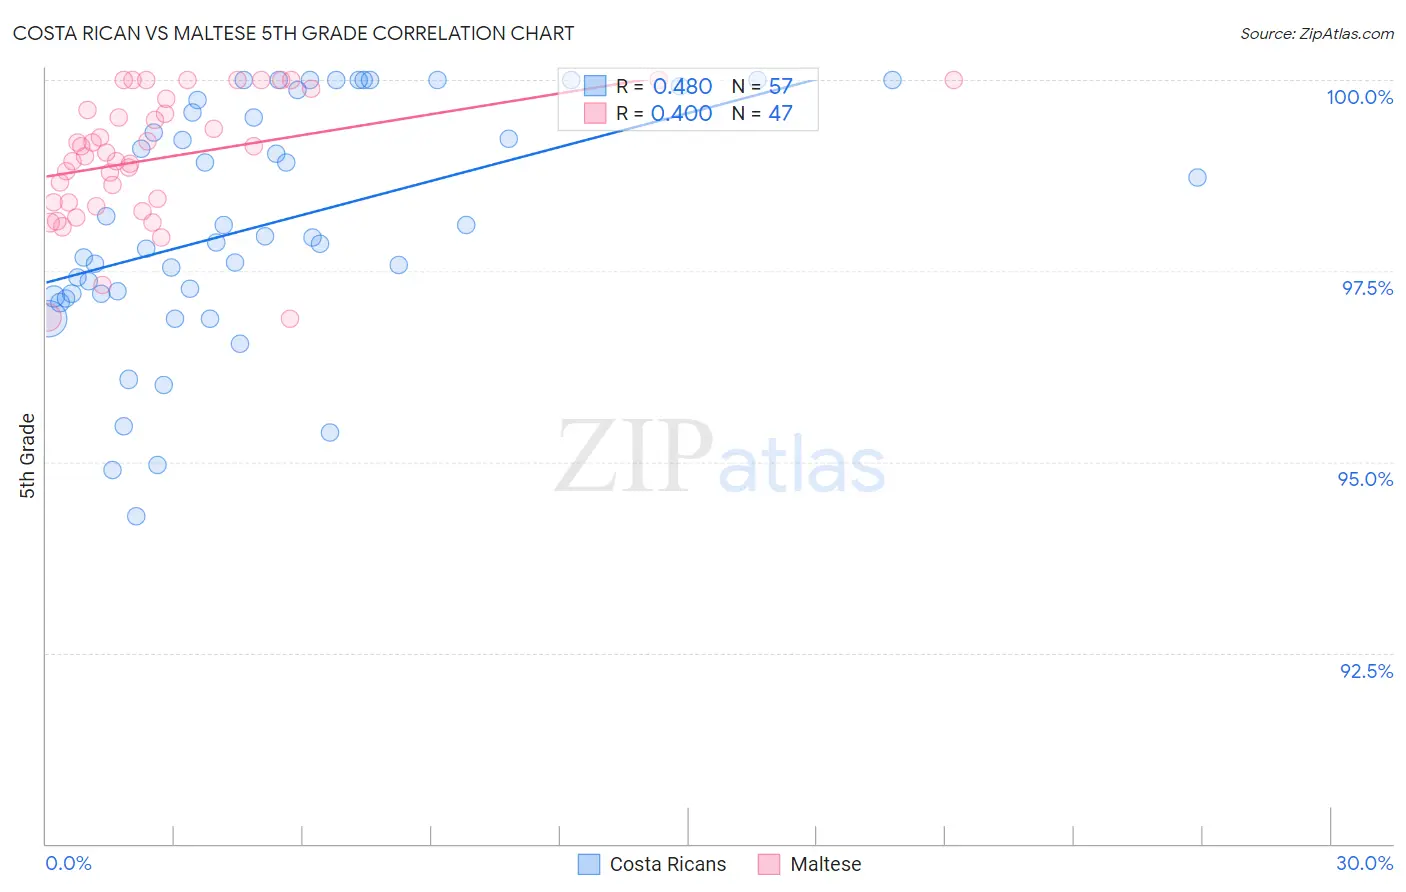
Costa Rican vs Maltese 5th Grade Correlation Chart
The statistical analysis conducted on geographies consisting of 253,599,979 people shows a moderate positive correlation between the proportion of Costa Ricans and percentage of population with at least 5th grade education in the United States with a correlation coefficient (R) of 0.480 and weighted average of 97.1%. Similarly, the statistical analysis conducted on geographies consisting of 126,476,608 people shows a moderate positive correlation between the proportion of Maltese and percentage of population with at least 5th grade education in the United States with a correlation coefficient (R) of 0.400 and weighted average of 98.0%, a difference of 0.91%.
5th Grade Correlation Summary
| Measurement | Costa Rican | Maltese |
| Minimum | 94.3% | 96.9% |
| Maximum | 100.0% | 100.0% |
| Range | 5.7% | 3.1% |
| Mean | 98.1% | 99.0% |
| Median | 97.9% | 99.0% |
| Interquartile 25% (IQ1) | 97.2% | 98.4% |
| Interquartile 75% (IQ3) | 99.7% | 99.8% |
| Interquartile Range (IQR) | 2.5% | 1.4% |
| Standard Deviation (Sample) | 1.5% | 0.83% |
| Standard Deviation (Population) | 1.5% | 0.82% |
Similar Demographics by 5th Grade
Demographics Similar to Costa Ricans by 5th Grade
In terms of 5th grade, the demographic groups most similar to Costa Ricans are Portuguese (97.1%, a difference of 0.0%), Immigrants from Morocco (97.1%, a difference of 0.0%), Samoan (97.1%, a difference of 0.010%), Immigrants from Iraq (97.1%, a difference of 0.010%), and Sudanese (97.1%, a difference of 0.010%).
| Demographics | Rating | Rank | 5th Grade |
| Iraqis | 10.9 /100 | #207 | Poor 97.1% |
| Laotians | 10.8 /100 | #208 | Poor 97.1% |
| Immigrants | Nepal | 10.3 /100 | #209 | Poor 97.1% |
| Immigrants | Oceania | 10.0 /100 | #210 | Poor 97.1% |
| Samoans | 8.5 /100 | #211 | Tragic 97.1% |
| Immigrants | Iraq | 8.3 /100 | #212 | Tragic 97.1% |
| Portuguese | 7.8 /100 | #213 | Tragic 97.1% |
| Costa Ricans | 7.7 /100 | #214 | Tragic 97.1% |
| Immigrants | Morocco | 7.5 /100 | #215 | Tragic 97.1% |
| Sudanese | 7.0 /100 | #216 | Tragic 97.1% |
| Immigrants | Lebanon | 6.8 /100 | #217 | Tragic 97.1% |
| Immigrants | Sudan | 6.5 /100 | #218 | Tragic 97.1% |
| Immigrants | Syria | 6.4 /100 | #219 | Tragic 97.1% |
| Immigrants | Southern Europe | 6.3 /100 | #220 | Tragic 97.1% |
| Sierra Leoneans | 6.0 /100 | #221 | Tragic 97.1% |
Demographics Similar to Maltese by 5th Grade
In terms of 5th grade, the demographic groups most similar to Maltese are Slavic (98.0%, a difference of 0.0%), Estonian (98.0%, a difference of 0.010%), Immigrants from Scotland (98.0%, a difference of 0.010%), Celtic (98.0%, a difference of 0.010%), and Australian (98.0%, a difference of 0.010%).
| Demographics | Rating | Rank | 5th Grade |
| Czechoslovakians | 99.9 /100 | #45 | Exceptional 98.0% |
| Arapaho | 99.9 /100 | #46 | Exceptional 98.0% |
| Native Hawaiians | 99.9 /100 | #47 | Exceptional 98.0% |
| Bulgarians | 99.8 /100 | #48 | Exceptional 98.0% |
| Estonians | 99.8 /100 | #49 | Exceptional 98.0% |
| Immigrants | Scotland | 99.8 /100 | #50 | Exceptional 98.0% |
| Celtics | 99.8 /100 | #51 | Exceptional 98.0% |
| Maltese | 99.8 /100 | #52 | Exceptional 98.0% |
| Slavs | 99.8 /100 | #53 | Exceptional 98.0% |
| Australians | 99.8 /100 | #54 | Exceptional 98.0% |
| Creek | 99.8 /100 | #55 | Exceptional 98.0% |
| Greeks | 99.8 /100 | #56 | Exceptional 97.9% |
| Austrians | 99.8 /100 | #57 | Exceptional 97.9% |
| Whites/Caucasians | 99.8 /100 | #58 | Exceptional 97.9% |
| Americans | 99.7 /100 | #59 | Exceptional 97.9% |