Choctaw vs Somali Currently Married
COMPARE
Choctaw
Somali
Currently Married
Currently Married Comparison
Choctaw
Somalis
46.3%
CURRENTLY MARRIED
29.1/ 100
METRIC RATING
190th/ 347
METRIC RANK
41.5%
CURRENTLY MARRIED
0.0/ 100
METRIC RATING
312th/ 347
METRIC RANK
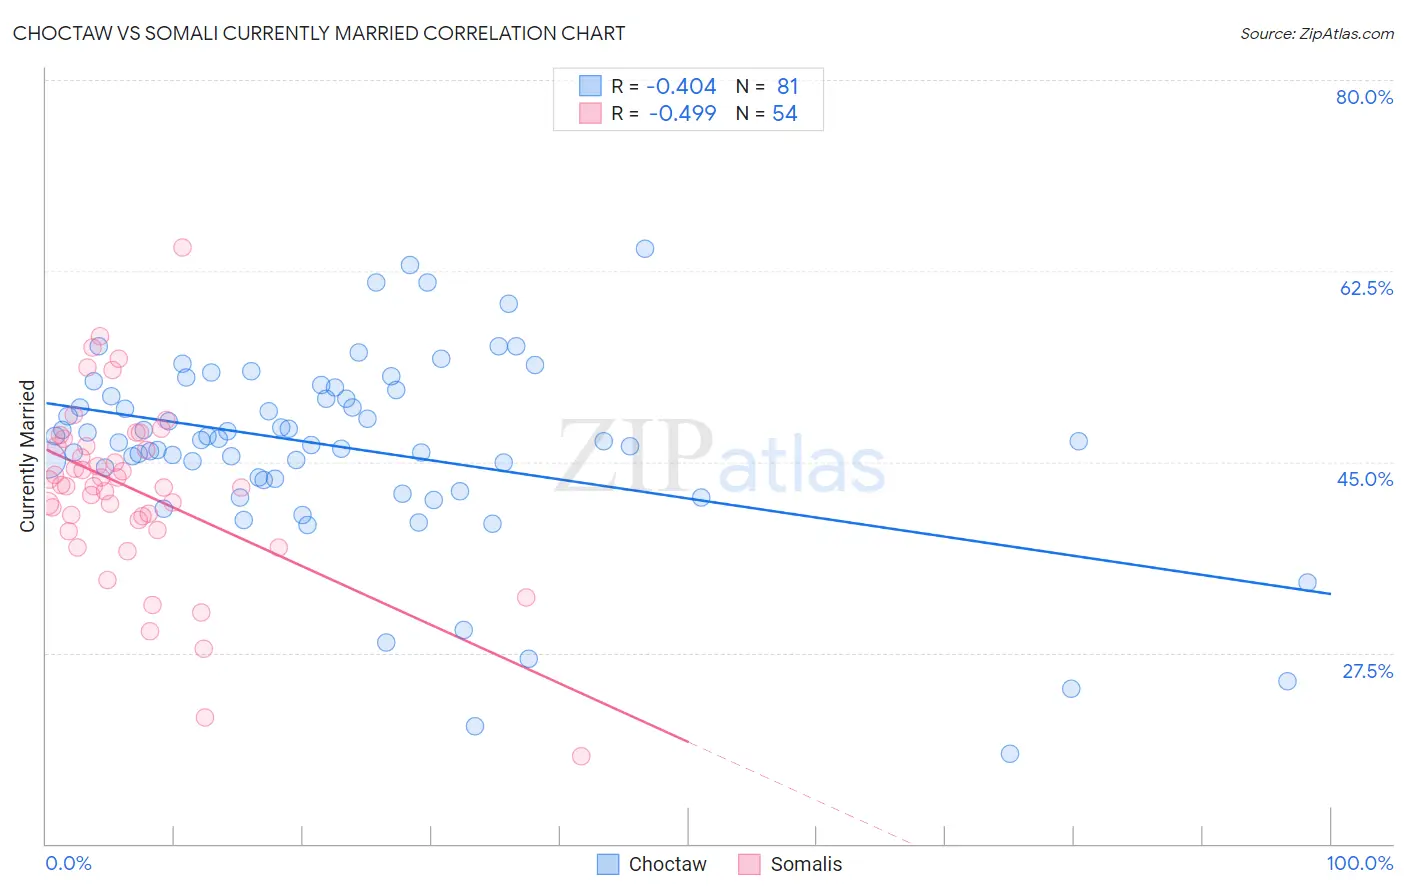
Choctaw vs Somali Currently Married Correlation Chart
The statistical analysis conducted on geographies consisting of 269,717,873 people shows a moderate negative correlation between the proportion of Choctaw and percentage of population currently married in the United States with a correlation coefficient (R) of -0.404 and weighted average of 46.3%. Similarly, the statistical analysis conducted on geographies consisting of 99,327,030 people shows a moderate negative correlation between the proportion of Somalis and percentage of population currently married in the United States with a correlation coefficient (R) of -0.499 and weighted average of 41.5%, a difference of 11.5%.
Currently Married Correlation Summary
| Measurement | Choctaw | Somali |
| Minimum | 18.2% | 18.0% |
| Maximum | 64.5% | 64.7% |
| Range | 46.3% | 46.7% |
| Mean | 46.2% | 42.5% |
| Median | 46.9% | 42.8% |
| Interquartile 25% (IQ1) | 43.4% | 39.7% |
| Interquartile 75% (IQ3) | 51.3% | 46.5% |
| Interquartile Range (IQR) | 7.9% | 6.8% |
| Standard Deviation (Sample) | 8.8% | 8.1% |
| Standard Deviation (Population) | 8.7% | 8.1% |
Similar Demographics by Currently Married
Demographics Similar to Choctaw by Currently Married
In terms of currently married, the demographic groups most similar to Choctaw are Fijian (46.3%, a difference of 0.050%), Immigrants from France (46.2%, a difference of 0.060%), Colombian (46.3%, a difference of 0.12%), Soviet Union (46.2%, a difference of 0.16%), and Immigrants from Fiji (46.2%, a difference of 0.19%).
| Demographics | Rating | Rank | Currently Married |
| Immigrants | Northern Africa | 39.7 /100 | #183 | Fair 46.5% |
| Brazilians | 39.3 /100 | #184 | Fair 46.4% |
| Mongolians | 37.6 /100 | #185 | Fair 46.4% |
| Immigrants | Chile | 36.8 /100 | #186 | Fair 46.4% |
| Immigrants | Peru | 35.3 /100 | #187 | Fair 46.4% |
| Colombians | 31.8 /100 | #188 | Fair 46.3% |
| Fijians | 30.3 /100 | #189 | Fair 46.3% |
| Choctaw | 29.1 /100 | #190 | Fair 46.3% |
| Immigrants | France | 27.7 /100 | #191 | Fair 46.2% |
| Soviet Union | 25.7 /100 | #192 | Fair 46.2% |
| Immigrants | Fiji | 25.0 /100 | #193 | Fair 46.2% |
| South Americans | 23.8 /100 | #194 | Fair 46.1% |
| Immigrants | Nepal | 23.7 /100 | #195 | Fair 46.1% |
| Immigrants | Bosnia and Herzegovina | 22.2 /100 | #196 | Fair 46.1% |
| Immigrants | Kuwait | 21.7 /100 | #197 | Fair 46.1% |
Demographics Similar to Somalis by Currently Married
In terms of currently married, the demographic groups most similar to Somalis are Trinidadian and Tobagonian (41.5%, a difference of 0.18%), Jamaican (41.4%, a difference of 0.29%), Guyanese (41.6%, a difference of 0.33%), West Indian (41.3%, a difference of 0.36%), and Inupiat (41.3%, a difference of 0.45%).
| Demographics | Rating | Rank | Currently Married |
| Immigrants | Trinidad and Tobago | 0.0 /100 | #305 | Tragic 41.9% |
| Immigrants | Guyana | 0.0 /100 | #306 | Tragic 41.9% |
| Africans | 0.0 /100 | #307 | Tragic 41.8% |
| Immigrants | Belize | 0.0 /100 | #308 | Tragic 41.8% |
| Immigrants | Liberia | 0.0 /100 | #309 | Tragic 41.8% |
| Guyanese | 0.0 /100 | #310 | Tragic 41.6% |
| Trinidadians and Tobagonians | 0.0 /100 | #311 | Tragic 41.5% |
| Somalis | 0.0 /100 | #312 | Tragic 41.5% |
| Jamaicans | 0.0 /100 | #313 | Tragic 41.4% |
| West Indians | 0.0 /100 | #314 | Tragic 41.3% |
| Inupiat | 0.0 /100 | #315 | Tragic 41.3% |
| Immigrants | Caribbean | 0.0 /100 | #316 | Tragic 41.3% |
| Haitians | 0.0 /100 | #317 | Tragic 41.3% |
| Bahamians | 0.0 /100 | #318 | Tragic 41.2% |
| Immigrants | Somalia | 0.0 /100 | #319 | Tragic 41.2% |