Immigrants from North America vs Somali Currently Married
COMPARE
Immigrants from North America
Somali
Currently Married
Currently Married Comparison
Immigrants from North America
Somalis
48.7%
CURRENTLY MARRIED
99.3/ 100
METRIC RATING
44th/ 347
METRIC RANK
41.5%
CURRENTLY MARRIED
0.0/ 100
METRIC RATING
312th/ 347
METRIC RANK
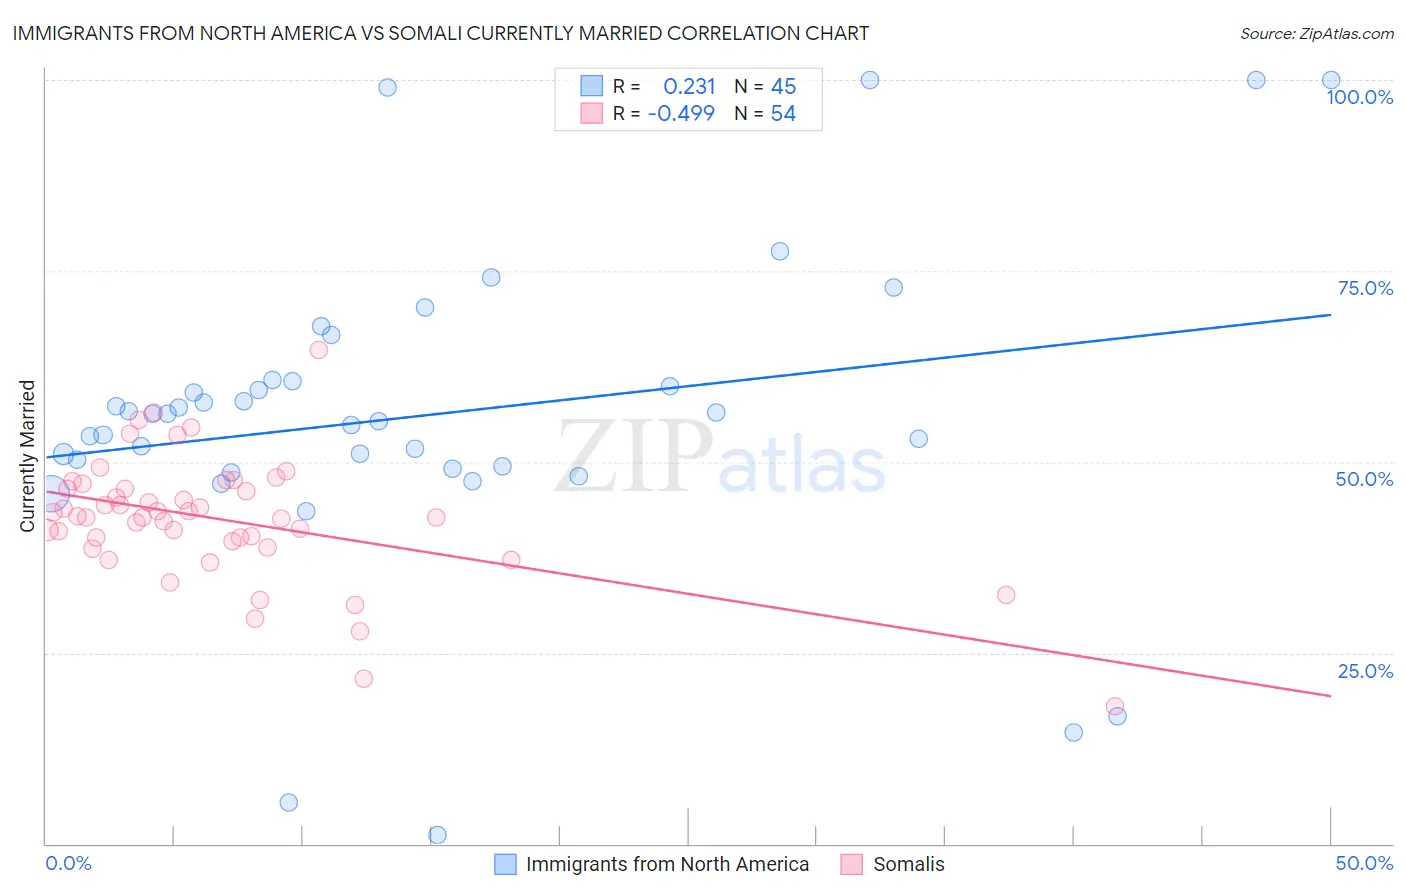
Immigrants from North America vs Somali Currently Married Correlation Chart
The statistical analysis conducted on geographies consisting of 462,399,389 people shows a weak positive correlation between the proportion of Immigrants from North America and percentage of population currently married in the United States with a correlation coefficient (R) of 0.231 and weighted average of 48.7%. Similarly, the statistical analysis conducted on geographies consisting of 99,327,030 people shows a moderate negative correlation between the proportion of Somalis and percentage of population currently married in the United States with a correlation coefficient (R) of -0.499 and weighted average of 41.5%, a difference of 17.5%.
Currently Married Correlation Summary
| Measurement | Immigrants from North America | Somali |
| Minimum | 1.1% | 18.0% |
| Maximum | 100.0% | 64.7% |
| Range | 98.9% | 46.7% |
| Mean | 56.2% | 42.5% |
| Median | 56.2% | 42.8% |
| Interquartile 25% (IQ1) | 49.3% | 39.7% |
| Interquartile 75% (IQ3) | 60.6% | 46.5% |
| Interquartile Range (IQR) | 11.4% | 6.8% |
| Standard Deviation (Sample) | 20.7% | 8.1% |
| Standard Deviation (Population) | 20.5% | 8.1% |
Similar Demographics by Currently Married
Demographics Similar to Immigrants from North America by Currently Married
In terms of currently married, the demographic groups most similar to Immigrants from North America are Scotch-Irish (48.7%, a difference of 0.030%), Belgian (48.7%, a difference of 0.030%), Finnish (48.8%, a difference of 0.040%), Immigrants from Iran (48.7%, a difference of 0.060%), and Northern European (48.7%, a difference of 0.060%).
| Demographics | Rating | Rank | Currently Married |
| Hungarians | 99.4 /100 | #37 | Exceptional 48.8% |
| Czechoslovakians | 99.4 /100 | #38 | Exceptional 48.8% |
| British | 99.4 /100 | #39 | Exceptional 48.8% |
| Immigrants | Canada | 99.4 /100 | #40 | Exceptional 48.8% |
| Greeks | 99.3 /100 | #41 | Exceptional 48.8% |
| Finns | 99.3 /100 | #42 | Exceptional 48.8% |
| Scotch-Irish | 99.3 /100 | #43 | Exceptional 48.7% |
| Immigrants | North America | 99.3 /100 | #44 | Exceptional 48.7% |
| Belgians | 99.3 /100 | #45 | Exceptional 48.7% |
| Immigrants | Iran | 99.2 /100 | #46 | Exceptional 48.7% |
| Northern Europeans | 99.2 /100 | #47 | Exceptional 48.7% |
| Austrians | 99.2 /100 | #48 | Exceptional 48.7% |
| Bhutanese | 99.1 /100 | #49 | Exceptional 48.6% |
| Iranians | 99.0 /100 | #50 | Exceptional 48.6% |
| Whites/Caucasians | 99.0 /100 | #51 | Exceptional 48.6% |
Demographics Similar to Somalis by Currently Married
In terms of currently married, the demographic groups most similar to Somalis are Trinidadian and Tobagonian (41.5%, a difference of 0.18%), Jamaican (41.4%, a difference of 0.29%), Guyanese (41.6%, a difference of 0.33%), West Indian (41.3%, a difference of 0.36%), and Inupiat (41.3%, a difference of 0.45%).
| Demographics | Rating | Rank | Currently Married |
| Immigrants | Trinidad and Tobago | 0.0 /100 | #305 | Tragic 41.9% |
| Immigrants | Guyana | 0.0 /100 | #306 | Tragic 41.9% |
| Africans | 0.0 /100 | #307 | Tragic 41.8% |
| Immigrants | Belize | 0.0 /100 | #308 | Tragic 41.8% |
| Immigrants | Liberia | 0.0 /100 | #309 | Tragic 41.8% |
| Guyanese | 0.0 /100 | #310 | Tragic 41.6% |
| Trinidadians and Tobagonians | 0.0 /100 | #311 | Tragic 41.5% |
| Somalis | 0.0 /100 | #312 | Tragic 41.5% |
| Jamaicans | 0.0 /100 | #313 | Tragic 41.4% |
| West Indians | 0.0 /100 | #314 | Tragic 41.3% |
| Inupiat | 0.0 /100 | #315 | Tragic 41.3% |
| Immigrants | Caribbean | 0.0 /100 | #316 | Tragic 41.3% |
| Haitians | 0.0 /100 | #317 | Tragic 41.3% |
| Bahamians | 0.0 /100 | #318 | Tragic 41.2% |
| Immigrants | Somalia | 0.0 /100 | #319 | Tragic 41.2% |