Choctaw vs Immigrants from Hungary Currently Married
COMPARE
Choctaw
Immigrants from Hungary
Currently Married
Currently Married Comparison
Choctaw
Immigrants from Hungary
46.3%
CURRENTLY MARRIED
29.1/ 100
METRIC RATING
190th/ 347
METRIC RANK
47.6%
CURRENTLY MARRIED
91.2/ 100
METRIC RATING
111th/ 347
METRIC RANK
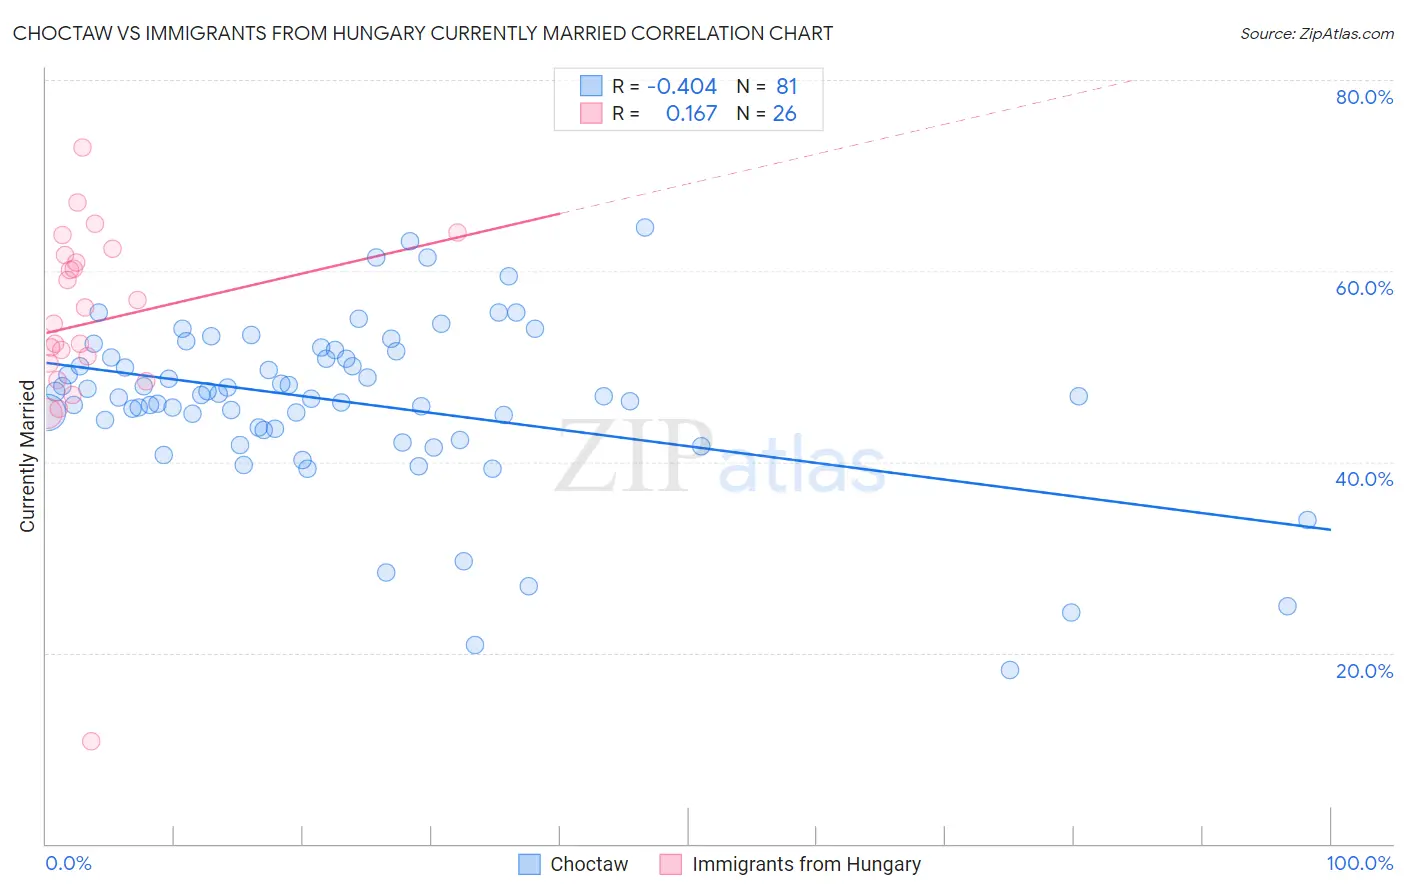
Choctaw vs Immigrants from Hungary Currently Married Correlation Chart
The statistical analysis conducted on geographies consisting of 269,717,873 people shows a moderate negative correlation between the proportion of Choctaw and percentage of population currently married in the United States with a correlation coefficient (R) of -0.404 and weighted average of 46.3%. Similarly, the statistical analysis conducted on geographies consisting of 195,704,410 people shows a poor positive correlation between the proportion of Immigrants from Hungary and percentage of population currently married in the United States with a correlation coefficient (R) of 0.167 and weighted average of 47.6%, a difference of 3.0%.
Currently Married Correlation Summary
| Measurement | Choctaw | Immigrants from Hungary |
| Minimum | 18.2% | 10.7% |
| Maximum | 64.5% | 72.9% |
| Range | 46.3% | 62.2% |
| Mean | 46.2% | 54.6% |
| Median | 46.9% | 55.3% |
| Interquartile 25% (IQ1) | 43.4% | 50.3% |
| Interquartile 75% (IQ3) | 51.3% | 61.7% |
| Interquartile Range (IQR) | 7.9% | 11.4% |
| Standard Deviation (Sample) | 8.8% | 11.5% |
| Standard Deviation (Population) | 8.7% | 11.3% |
Similar Demographics by Currently Married
Demographics Similar to Choctaw by Currently Married
In terms of currently married, the demographic groups most similar to Choctaw are Fijian (46.3%, a difference of 0.050%), Immigrants from France (46.2%, a difference of 0.060%), Colombian (46.3%, a difference of 0.12%), Soviet Union (46.2%, a difference of 0.16%), and Immigrants from Fiji (46.2%, a difference of 0.19%).
| Demographics | Rating | Rank | Currently Married |
| Immigrants | Northern Africa | 39.7 /100 | #183 | Fair 46.5% |
| Brazilians | 39.3 /100 | #184 | Fair 46.4% |
| Mongolians | 37.6 /100 | #185 | Fair 46.4% |
| Immigrants | Chile | 36.8 /100 | #186 | Fair 46.4% |
| Immigrants | Peru | 35.3 /100 | #187 | Fair 46.4% |
| Colombians | 31.8 /100 | #188 | Fair 46.3% |
| Fijians | 30.3 /100 | #189 | Fair 46.3% |
| Choctaw | 29.1 /100 | #190 | Fair 46.3% |
| Immigrants | France | 27.7 /100 | #191 | Fair 46.2% |
| Soviet Union | 25.7 /100 | #192 | Fair 46.2% |
| Immigrants | Fiji | 25.0 /100 | #193 | Fair 46.2% |
| South Americans | 23.8 /100 | #194 | Fair 46.1% |
| Immigrants | Nepal | 23.7 /100 | #195 | Fair 46.1% |
| Immigrants | Bosnia and Herzegovina | 22.2 /100 | #196 | Fair 46.1% |
| Immigrants | Kuwait | 21.7 /100 | #197 | Fair 46.1% |
Demographics Similar to Immigrants from Hungary by Currently Married
In terms of currently married, the demographic groups most similar to Immigrants from Hungary are Immigrants from Western Europe (47.6%, a difference of 0.010%), Immigrants from Denmark (47.6%, a difference of 0.040%), South African (47.6%, a difference of 0.070%), Immigrants from Indonesia (47.6%, a difference of 0.070%), and Palestinian (47.6%, a difference of 0.080%).
| Demographics | Rating | Rank | Currently Married |
| Serbians | 93.6 /100 | #104 | Exceptional 47.8% |
| Immigrants | Singapore | 93.3 /100 | #105 | Exceptional 47.8% |
| Immigrants | Greece | 93.1 /100 | #106 | Exceptional 47.7% |
| Immigrants | Italy | 92.9 /100 | #107 | Exceptional 47.7% |
| Tsimshian | 92.4 /100 | #108 | Exceptional 47.7% |
| Immigrants | Egypt | 92.3 /100 | #109 | Exceptional 47.7% |
| Immigrants | Russia | 92.0 /100 | #110 | Exceptional 47.7% |
| Immigrants | Hungary | 91.2 /100 | #111 | Exceptional 47.6% |
| Immigrants | Western Europe | 91.1 /100 | #112 | Exceptional 47.6% |
| Immigrants | Denmark | 90.9 /100 | #113 | Exceptional 47.6% |
| South Africans | 90.5 /100 | #114 | Exceptional 47.6% |
| Immigrants | Indonesia | 90.5 /100 | #115 | Exceptional 47.6% |
| Palestinians | 90.4 /100 | #116 | Exceptional 47.6% |
| Puget Sound Salish | 90.3 /100 | #117 | Exceptional 47.6% |
| Immigrants | Philippines | 90.2 /100 | #118 | Exceptional 47.6% |