Choctaw vs Lumbee Currently Married
COMPARE
Choctaw
Lumbee
Currently Married
Currently Married Comparison
Choctaw
Lumbee
46.3%
CURRENTLY MARRIED
29.1/ 100
METRIC RATING
190th/ 347
METRIC RANK
39.8%
CURRENTLY MARRIED
0.0/ 100
METRIC RATING
335th/ 347
METRIC RANK
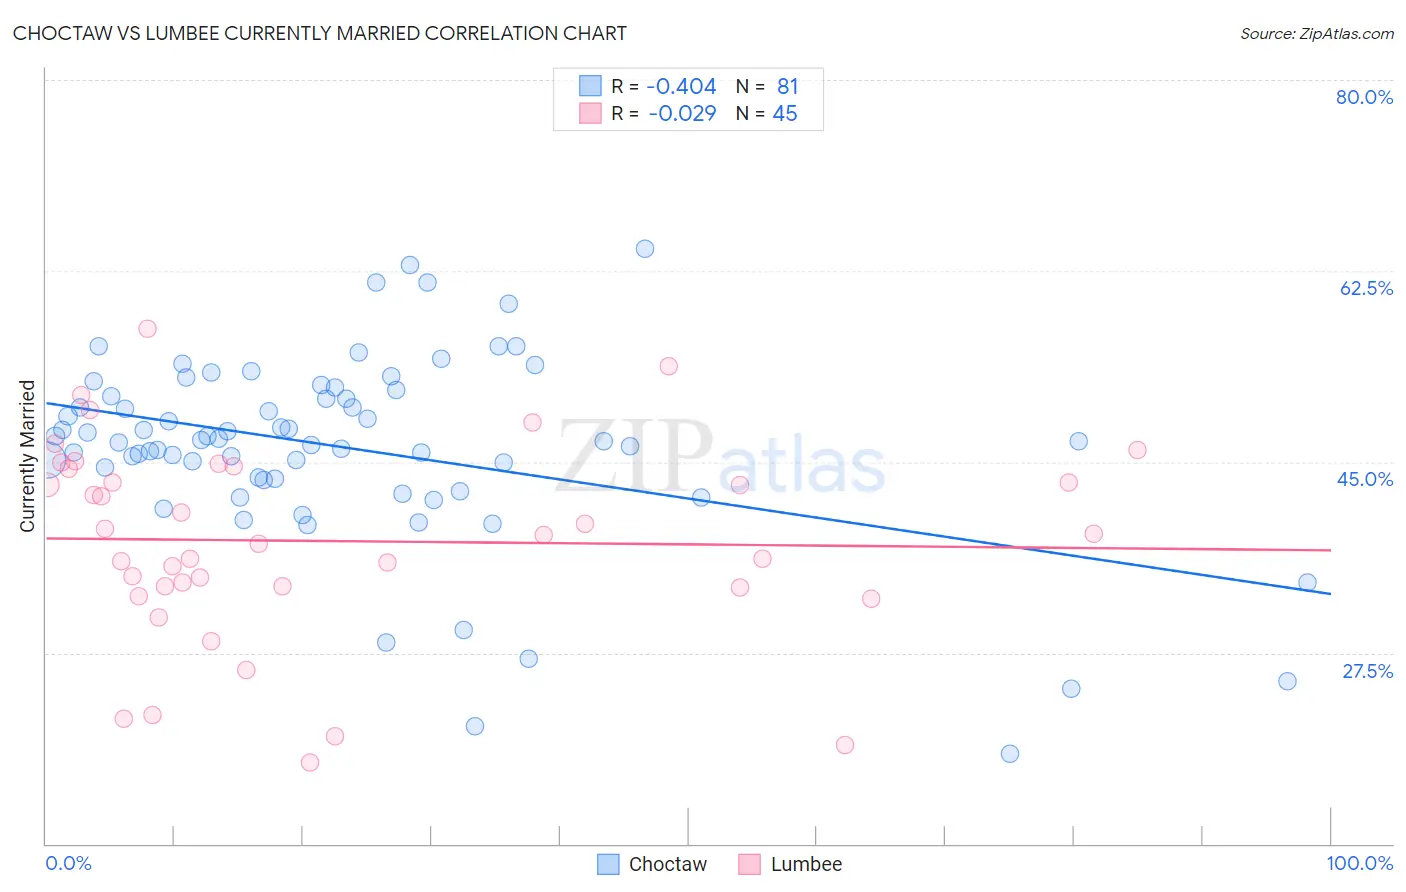
Choctaw vs Lumbee Currently Married Correlation Chart
The statistical analysis conducted on geographies consisting of 269,717,873 people shows a moderate negative correlation between the proportion of Choctaw and percentage of population currently married in the United States with a correlation coefficient (R) of -0.404 and weighted average of 46.3%. Similarly, the statistical analysis conducted on geographies consisting of 92,298,299 people shows no correlation between the proportion of Lumbee and percentage of population currently married in the United States with a correlation coefficient (R) of -0.029 and weighted average of 39.8%, a difference of 16.1%.
Currently Married Correlation Summary
| Measurement | Choctaw | Lumbee |
| Minimum | 18.2% | 17.4% |
| Maximum | 64.5% | 57.2% |
| Range | 46.3% | 39.8% |
| Mean | 46.2% | 37.7% |
| Median | 46.9% | 38.3% |
| Interquartile 25% (IQ1) | 43.4% | 33.5% |
| Interquartile 75% (IQ3) | 51.3% | 44.5% |
| Interquartile Range (IQR) | 7.9% | 10.9% |
| Standard Deviation (Sample) | 8.8% | 9.1% |
| Standard Deviation (Population) | 8.7% | 9.0% |
Similar Demographics by Currently Married
Demographics Similar to Choctaw by Currently Married
In terms of currently married, the demographic groups most similar to Choctaw are Fijian (46.3%, a difference of 0.050%), Immigrants from France (46.2%, a difference of 0.060%), Colombian (46.3%, a difference of 0.12%), Soviet Union (46.2%, a difference of 0.16%), and Immigrants from Fiji (46.2%, a difference of 0.19%).
| Demographics | Rating | Rank | Currently Married |
| Immigrants | Northern Africa | 39.7 /100 | #183 | Fair 46.5% |
| Brazilians | 39.3 /100 | #184 | Fair 46.4% |
| Mongolians | 37.6 /100 | #185 | Fair 46.4% |
| Immigrants | Chile | 36.8 /100 | #186 | Fair 46.4% |
| Immigrants | Peru | 35.3 /100 | #187 | Fair 46.4% |
| Colombians | 31.8 /100 | #188 | Fair 46.3% |
| Fijians | 30.3 /100 | #189 | Fair 46.3% |
| Choctaw | 29.1 /100 | #190 | Fair 46.3% |
| Immigrants | France | 27.7 /100 | #191 | Fair 46.2% |
| Soviet Union | 25.7 /100 | #192 | Fair 46.2% |
| Immigrants | Fiji | 25.0 /100 | #193 | Fair 46.2% |
| South Americans | 23.8 /100 | #194 | Fair 46.1% |
| Immigrants | Nepal | 23.7 /100 | #195 | Fair 46.1% |
| Immigrants | Bosnia and Herzegovina | 22.2 /100 | #196 | Fair 46.1% |
| Immigrants | Kuwait | 21.7 /100 | #197 | Fair 46.1% |
Demographics Similar to Lumbee by Currently Married
In terms of currently married, the demographic groups most similar to Lumbee are Puerto Rican (39.9%, a difference of 0.16%), Yup'ik (39.9%, a difference of 0.18%), British West Indian (39.8%, a difference of 0.18%), Black/African American (39.6%, a difference of 0.56%), and Immigrants from St. Vincent and the Grenadines (40.1%, a difference of 0.57%).
| Demographics | Rating | Rank | Currently Married |
| Arapaho | 0.0 /100 | #328 | Tragic 40.5% |
| Crow | 0.0 /100 | #329 | Tragic 40.4% |
| Immigrants | Dominica | 0.0 /100 | #330 | Tragic 40.3% |
| Immigrants | Barbados | 0.0 /100 | #331 | Tragic 40.3% |
| Immigrants | St. Vincent and the Grenadines | 0.0 /100 | #332 | Tragic 40.1% |
| Yup'ik | 0.0 /100 | #333 | Tragic 39.9% |
| Puerto Ricans | 0.0 /100 | #334 | Tragic 39.9% |
| Lumbee | 0.0 /100 | #335 | Tragic 39.8% |
| British West Indians | 0.0 /100 | #336 | Tragic 39.8% |
| Blacks/African Americans | 0.0 /100 | #337 | Tragic 39.6% |
| Cape Verdeans | 0.0 /100 | #338 | Tragic 39.6% |
| Dominicans | 0.0 /100 | #339 | Tragic 39.5% |
| Immigrants | Grenada | 0.0 /100 | #340 | Tragic 39.1% |
| Navajo | 0.0 /100 | #341 | Tragic 39.0% |
| Immigrants | Dominican Republic | 0.0 /100 | #342 | Tragic 38.9% |