Choctaw vs Immigrants from Kazakhstan Currently Married
COMPARE
Choctaw
Immigrants from Kazakhstan
Currently Married
Currently Married Comparison
Choctaw
Immigrants from Kazakhstan
46.3%
CURRENTLY MARRIED
29.1/ 100
METRIC RATING
190th/ 347
METRIC RANK
47.4%
CURRENTLY MARRIED
87.2/ 100
METRIC RATING
123rd/ 347
METRIC RANK
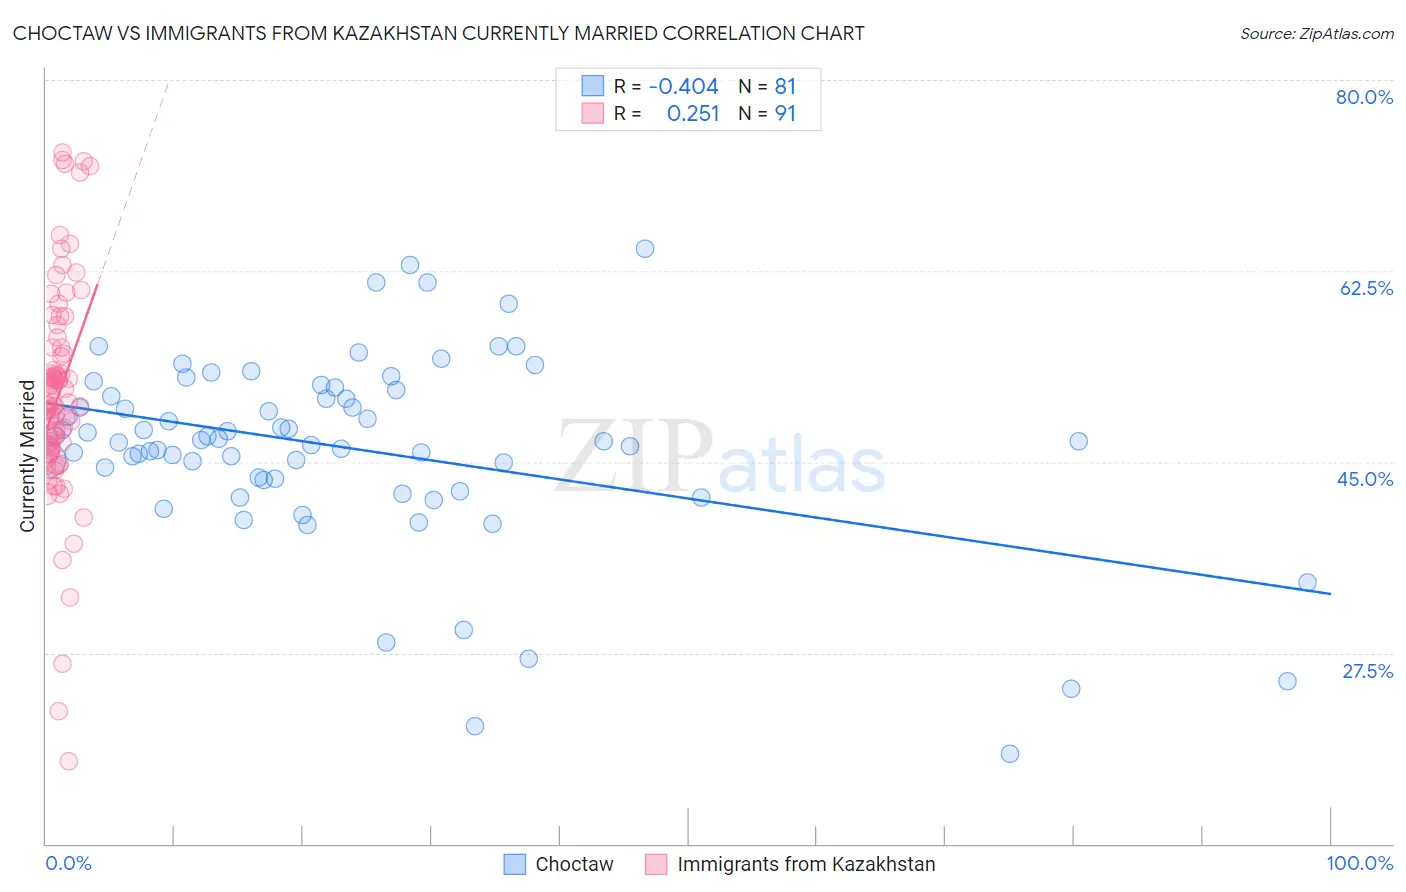
Choctaw vs Immigrants from Kazakhstan Currently Married Correlation Chart
The statistical analysis conducted on geographies consisting of 269,717,873 people shows a moderate negative correlation between the proportion of Choctaw and percentage of population currently married in the United States with a correlation coefficient (R) of -0.404 and weighted average of 46.3%. Similarly, the statistical analysis conducted on geographies consisting of 124,441,390 people shows a weak positive correlation between the proportion of Immigrants from Kazakhstan and percentage of population currently married in the United States with a correlation coefficient (R) of 0.251 and weighted average of 47.4%, a difference of 2.6%.
Currently Married Correlation Summary
| Measurement | Choctaw | Immigrants from Kazakhstan |
| Minimum | 18.2% | 17.6% |
| Maximum | 64.5% | 73.4% |
| Range | 46.3% | 55.8% |
| Mean | 46.2% | 51.1% |
| Median | 46.9% | 50.3% |
| Interquartile 25% (IQ1) | 43.4% | 46.3% |
| Interquartile 75% (IQ3) | 51.3% | 55.4% |
| Interquartile Range (IQR) | 7.9% | 9.1% |
| Standard Deviation (Sample) | 8.8% | 9.9% |
| Standard Deviation (Population) | 8.7% | 9.8% |
Similar Demographics by Currently Married
Demographics Similar to Choctaw by Currently Married
In terms of currently married, the demographic groups most similar to Choctaw are Fijian (46.3%, a difference of 0.050%), Immigrants from France (46.2%, a difference of 0.060%), Colombian (46.3%, a difference of 0.12%), Soviet Union (46.2%, a difference of 0.16%), and Immigrants from Fiji (46.2%, a difference of 0.19%).
| Demographics | Rating | Rank | Currently Married |
| Immigrants | Northern Africa | 39.7 /100 | #183 | Fair 46.5% |
| Brazilians | 39.3 /100 | #184 | Fair 46.4% |
| Mongolians | 37.6 /100 | #185 | Fair 46.4% |
| Immigrants | Chile | 36.8 /100 | #186 | Fair 46.4% |
| Immigrants | Peru | 35.3 /100 | #187 | Fair 46.4% |
| Colombians | 31.8 /100 | #188 | Fair 46.3% |
| Fijians | 30.3 /100 | #189 | Fair 46.3% |
| Choctaw | 29.1 /100 | #190 | Fair 46.3% |
| Immigrants | France | 27.7 /100 | #191 | Fair 46.2% |
| Soviet Union | 25.7 /100 | #192 | Fair 46.2% |
| Immigrants | Fiji | 25.0 /100 | #193 | Fair 46.2% |
| South Americans | 23.8 /100 | #194 | Fair 46.1% |
| Immigrants | Nepal | 23.7 /100 | #195 | Fair 46.1% |
| Immigrants | Bosnia and Herzegovina | 22.2 /100 | #196 | Fair 46.1% |
| Immigrants | Kuwait | 21.7 /100 | #197 | Fair 46.1% |
Demographics Similar to Immigrants from Kazakhstan by Currently Married
In terms of currently married, the demographic groups most similar to Immigrants from Kazakhstan are Laotian (47.4%, a difference of 0.050%), Osage (47.5%, a difference of 0.060%), Immigrants from Croatia (47.5%, a difference of 0.12%), Syrian (47.5%, a difference of 0.15%), and Okinawan (47.4%, a difference of 0.15%).
| Demographics | Rating | Rank | Currently Married |
| Palestinians | 90.4 /100 | #116 | Exceptional 47.6% |
| Puget Sound Salish | 90.3 /100 | #117 | Exceptional 47.6% |
| Immigrants | Philippines | 90.2 /100 | #118 | Exceptional 47.6% |
| Australians | 90.2 /100 | #119 | Exceptional 47.6% |
| Syrians | 88.9 /100 | #120 | Excellent 47.5% |
| Immigrants | Croatia | 88.6 /100 | #121 | Excellent 47.5% |
| Osage | 87.9 /100 | #122 | Excellent 47.5% |
| Immigrants | Kazakhstan | 87.2 /100 | #123 | Excellent 47.4% |
| Laotians | 86.6 /100 | #124 | Excellent 47.4% |
| Okinawans | 85.3 /100 | #125 | Excellent 47.4% |
| Immigrants | Jordan | 84.9 /100 | #126 | Excellent 47.4% |
| New Zealanders | 84.9 /100 | #127 | Excellent 47.4% |
| Portuguese | 84.2 /100 | #128 | Excellent 47.3% |
| Sri Lankans | 83.2 /100 | #129 | Excellent 47.3% |
| Immigrants | Iraq | 82.8 /100 | #130 | Excellent 47.3% |