Ugandan vs Somali Currently Married
COMPARE
Ugandan
Somali
Currently Married
Currently Married Comparison
Ugandans
Somalis
44.2%
CURRENTLY MARRIED
0.4/ 100
METRIC RATING
247th/ 347
METRIC RANK
41.5%
CURRENTLY MARRIED
0.0/ 100
METRIC RATING
312th/ 347
METRIC RANK
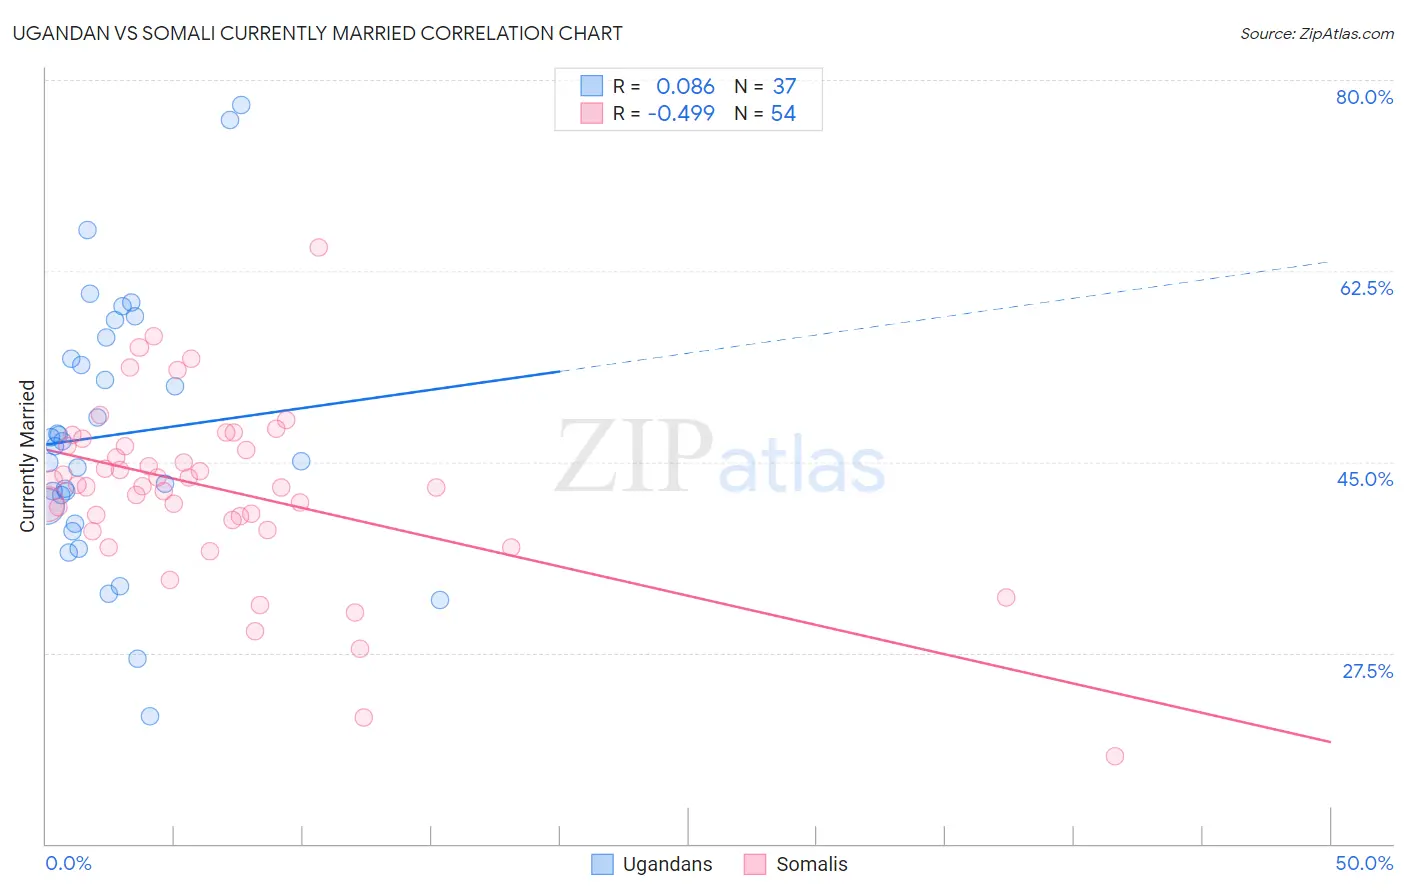
Ugandan vs Somali Currently Married Correlation Chart
The statistical analysis conducted on geographies consisting of 94,016,399 people shows a slight positive correlation between the proportion of Ugandans and percentage of population currently married in the United States with a correlation coefficient (R) of 0.086 and weighted average of 44.2%. Similarly, the statistical analysis conducted on geographies consisting of 99,327,030 people shows a moderate negative correlation between the proportion of Somalis and percentage of population currently married in the United States with a correlation coefficient (R) of -0.499 and weighted average of 41.5%, a difference of 6.7%.
Currently Married Correlation Summary
| Measurement | Ugandan | Somali |
| Minimum | 21.7% | 18.0% |
| Maximum | 77.7% | 64.7% |
| Range | 56.0% | 46.7% |
| Mean | 47.5% | 42.5% |
| Median | 46.4% | 42.8% |
| Interquartile 25% (IQ1) | 40.1% | 39.7% |
| Interquartile 75% (IQ3) | 55.4% | 46.5% |
| Interquartile Range (IQR) | 15.3% | 6.8% |
| Standard Deviation (Sample) | 12.1% | 8.1% |
| Standard Deviation (Population) | 11.9% | 8.1% |
Similar Demographics by Currently Married
Demographics Similar to Ugandans by Currently Married
In terms of currently married, the demographic groups most similar to Ugandans are Nicaraguan (44.2%, a difference of 0.090%), Immigrants from Cameroon (44.2%, a difference of 0.10%), Immigrants from Eastern Africa (44.2%, a difference of 0.12%), Immigrants from Burma/Myanmar (44.3%, a difference of 0.13%), and Blackfeet (44.2%, a difference of 0.19%).
| Demographics | Rating | Rank | Currently Married |
| Mexican American Indians | 0.7 /100 | #240 | Tragic 44.5% |
| Ethiopians | 0.7 /100 | #241 | Tragic 44.5% |
| Immigrants | Cambodia | 0.7 /100 | #242 | Tragic 44.5% |
| Immigrants | Ethiopia | 0.7 /100 | #243 | Tragic 44.5% |
| Japanese | 0.6 /100 | #244 | Tragic 44.5% |
| Immigrants | Armenia | 0.4 /100 | #245 | Tragic 44.3% |
| Immigrants | Burma/Myanmar | 0.4 /100 | #246 | Tragic 44.3% |
| Ugandans | 0.4 /100 | #247 | Tragic 44.2% |
| Nicaraguans | 0.3 /100 | #248 | Tragic 44.2% |
| Immigrants | Cameroon | 0.3 /100 | #249 | Tragic 44.2% |
| Immigrants | Eastern Africa | 0.3 /100 | #250 | Tragic 44.2% |
| Blackfeet | 0.3 /100 | #251 | Tragic 44.2% |
| Hispanics or Latinos | 0.3 /100 | #252 | Tragic 44.1% |
| Immigrants | Central America | 0.3 /100 | #253 | Tragic 44.1% |
| Vietnamese | 0.2 /100 | #254 | Tragic 44.0% |
Demographics Similar to Somalis by Currently Married
In terms of currently married, the demographic groups most similar to Somalis are Trinidadian and Tobagonian (41.5%, a difference of 0.18%), Jamaican (41.4%, a difference of 0.29%), Guyanese (41.6%, a difference of 0.33%), West Indian (41.3%, a difference of 0.36%), and Inupiat (41.3%, a difference of 0.45%).
| Demographics | Rating | Rank | Currently Married |
| Immigrants | Trinidad and Tobago | 0.0 /100 | #305 | Tragic 41.9% |
| Immigrants | Guyana | 0.0 /100 | #306 | Tragic 41.9% |
| Africans | 0.0 /100 | #307 | Tragic 41.8% |
| Immigrants | Belize | 0.0 /100 | #308 | Tragic 41.8% |
| Immigrants | Liberia | 0.0 /100 | #309 | Tragic 41.8% |
| Guyanese | 0.0 /100 | #310 | Tragic 41.6% |
| Trinidadians and Tobagonians | 0.0 /100 | #311 | Tragic 41.5% |
| Somalis | 0.0 /100 | #312 | Tragic 41.5% |
| Jamaicans | 0.0 /100 | #313 | Tragic 41.4% |
| West Indians | 0.0 /100 | #314 | Tragic 41.3% |
| Inupiat | 0.0 /100 | #315 | Tragic 41.3% |
| Immigrants | Caribbean | 0.0 /100 | #316 | Tragic 41.3% |
| Haitians | 0.0 /100 | #317 | Tragic 41.3% |
| Bahamians | 0.0 /100 | #318 | Tragic 41.2% |
| Immigrants | Somalia | 0.0 /100 | #319 | Tragic 41.2% |