Immigrants from Scotland vs Somali Currently Married
COMPARE
Immigrants from Scotland
Somali
Currently Married
Currently Married Comparison
Immigrants from Scotland
Somalis
49.3%
CURRENTLY MARRIED
99.8/ 100
METRIC RATING
18th/ 347
METRIC RANK
41.5%
CURRENTLY MARRIED
0.0/ 100
METRIC RATING
312th/ 347
METRIC RANK
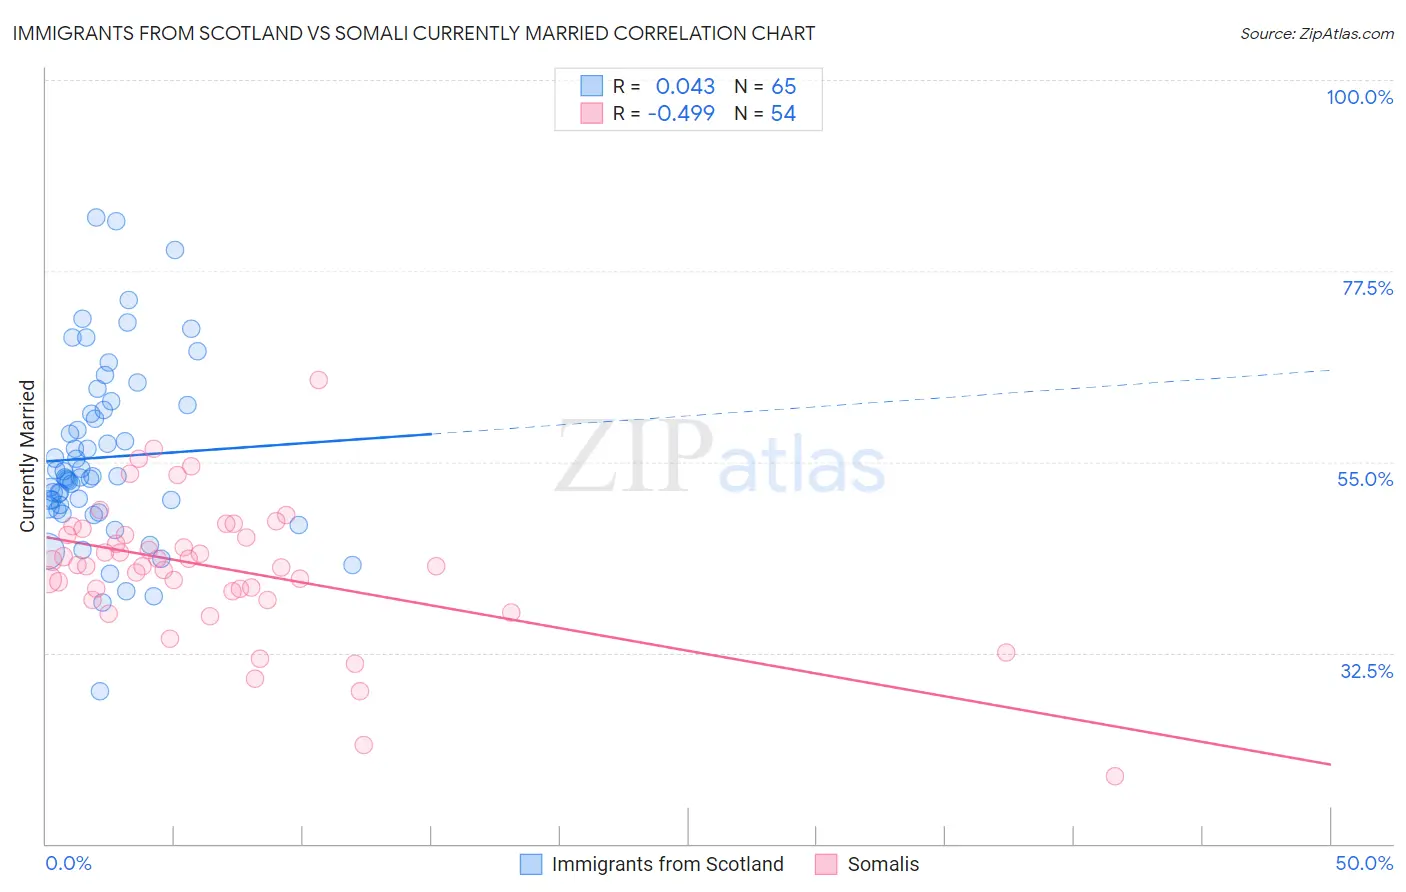
Immigrants from Scotland vs Somali Currently Married Correlation Chart
The statistical analysis conducted on geographies consisting of 196,396,392 people shows no correlation between the proportion of Immigrants from Scotland and percentage of population currently married in the United States with a correlation coefficient (R) of 0.043 and weighted average of 49.3%. Similarly, the statistical analysis conducted on geographies consisting of 99,327,030 people shows a moderate negative correlation between the proportion of Somalis and percentage of population currently married in the United States with a correlation coefficient (R) of -0.499 and weighted average of 41.5%, a difference of 19.0%.
Currently Married Correlation Summary
| Measurement | Immigrants from Scotland | Somali |
| Minimum | 27.9% | 18.0% |
| Maximum | 83.8% | 64.7% |
| Range | 55.9% | 46.7% |
| Mean | 55.5% | 42.5% |
| Median | 53.2% | 42.8% |
| Interquartile 25% (IQ1) | 49.5% | 39.7% |
| Interquartile 75% (IQ3) | 61.4% | 46.5% |
| Interquartile Range (IQR) | 11.9% | 6.8% |
| Standard Deviation (Sample) | 10.7% | 8.1% |
| Standard Deviation (Population) | 10.7% | 8.1% |
Similar Demographics by Currently Married
Demographics Similar to Immigrants from Scotland by Currently Married
In terms of currently married, the demographic groups most similar to Immigrants from Scotland are European (49.3%, a difference of 0.020%), Luxembourger (49.3%, a difference of 0.15%), Scottish (49.2%, a difference of 0.26%), Scandinavian (49.5%, a difference of 0.29%), and Chinese (49.5%, a difference of 0.31%).
| Demographics | Rating | Rank | Currently Married |
| English | 99.9 /100 | #11 | Exceptional 49.7% |
| Swiss | 99.9 /100 | #12 | Exceptional 49.7% |
| Dutch | 99.9 /100 | #13 | Exceptional 49.6% |
| Germans | 99.9 /100 | #14 | Exceptional 49.6% |
| Pennsylvania Germans | 99.9 /100 | #15 | Exceptional 49.6% |
| Chinese | 99.9 /100 | #16 | Exceptional 49.5% |
| Scandinavians | 99.9 /100 | #17 | Exceptional 49.5% |
| Immigrants | Scotland | 99.8 /100 | #18 | Exceptional 49.3% |
| Europeans | 99.8 /100 | #19 | Exceptional 49.3% |
| Luxembourgers | 99.8 /100 | #20 | Exceptional 49.3% |
| Scottish | 99.8 /100 | #21 | Exceptional 49.2% |
| Bulgarians | 99.7 /100 | #22 | Exceptional 49.1% |
| Immigrants | Pakistan | 99.7 /100 | #23 | Exceptional 49.1% |
| Lithuanians | 99.6 /100 | #24 | Exceptional 49.0% |
| Maltese | 99.6 /100 | #25 | Exceptional 49.0% |
Demographics Similar to Somalis by Currently Married
In terms of currently married, the demographic groups most similar to Somalis are Trinidadian and Tobagonian (41.5%, a difference of 0.18%), Jamaican (41.4%, a difference of 0.29%), Guyanese (41.6%, a difference of 0.33%), West Indian (41.3%, a difference of 0.36%), and Inupiat (41.3%, a difference of 0.45%).
| Demographics | Rating | Rank | Currently Married |
| Immigrants | Trinidad and Tobago | 0.0 /100 | #305 | Tragic 41.9% |
| Immigrants | Guyana | 0.0 /100 | #306 | Tragic 41.9% |
| Africans | 0.0 /100 | #307 | Tragic 41.8% |
| Immigrants | Belize | 0.0 /100 | #308 | Tragic 41.8% |
| Immigrants | Liberia | 0.0 /100 | #309 | Tragic 41.8% |
| Guyanese | 0.0 /100 | #310 | Tragic 41.6% |
| Trinidadians and Tobagonians | 0.0 /100 | #311 | Tragic 41.5% |
| Somalis | 0.0 /100 | #312 | Tragic 41.5% |
| Jamaicans | 0.0 /100 | #313 | Tragic 41.4% |
| West Indians | 0.0 /100 | #314 | Tragic 41.3% |
| Inupiat | 0.0 /100 | #315 | Tragic 41.3% |
| Immigrants | Caribbean | 0.0 /100 | #316 | Tragic 41.3% |
| Haitians | 0.0 /100 | #317 | Tragic 41.3% |
| Bahamians | 0.0 /100 | #318 | Tragic 41.2% |
| Immigrants | Somalia | 0.0 /100 | #319 | Tragic 41.2% |