Choctaw vs Immigrants from Austria Currently Married
COMPARE
Choctaw
Immigrants from Austria
Currently Married
Currently Married Comparison
Choctaw
Immigrants from Austria
46.3%
CURRENTLY MARRIED
29.1/ 100
METRIC RATING
190th/ 347
METRIC RANK
48.5%
CURRENTLY MARRIED
98.8/ 100
METRIC RATING
53rd/ 347
METRIC RANK
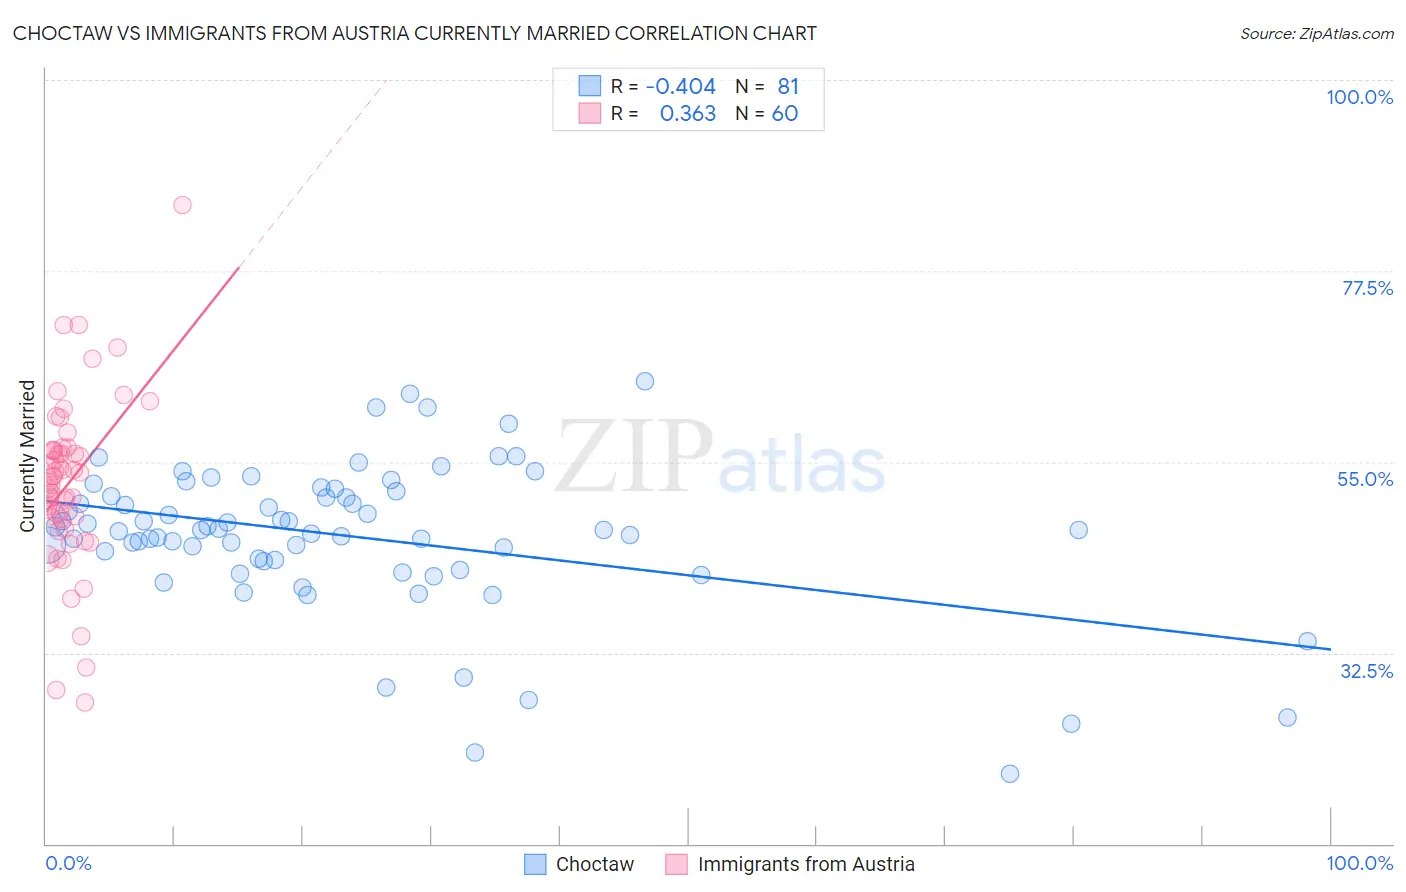
Choctaw vs Immigrants from Austria Currently Married Correlation Chart
The statistical analysis conducted on geographies consisting of 269,717,873 people shows a moderate negative correlation between the proportion of Choctaw and percentage of population currently married in the United States with a correlation coefficient (R) of -0.404 and weighted average of 46.3%. Similarly, the statistical analysis conducted on geographies consisting of 167,972,759 people shows a mild positive correlation between the proportion of Immigrants from Austria and percentage of population currently married in the United States with a correlation coefficient (R) of 0.363 and weighted average of 48.5%, a difference of 4.9%.
Currently Married Correlation Summary
| Measurement | Choctaw | Immigrants from Austria |
| Minimum | 18.2% | 26.6% |
| Maximum | 64.5% | 85.3% |
| Range | 46.3% | 58.7% |
| Mean | 46.2% | 52.5% |
| Median | 46.9% | 52.9% |
| Interquartile 25% (IQ1) | 43.4% | 48.4% |
| Interquartile 75% (IQ3) | 51.3% | 56.4% |
| Interquartile Range (IQR) | 7.9% | 8.0% |
| Standard Deviation (Sample) | 8.8% | 10.0% |
| Standard Deviation (Population) | 8.7% | 9.9% |
Similar Demographics by Currently Married
Demographics Similar to Choctaw by Currently Married
In terms of currently married, the demographic groups most similar to Choctaw are Fijian (46.3%, a difference of 0.050%), Immigrants from France (46.2%, a difference of 0.060%), Colombian (46.3%, a difference of 0.12%), Soviet Union (46.2%, a difference of 0.16%), and Immigrants from Fiji (46.2%, a difference of 0.19%).
| Demographics | Rating | Rank | Currently Married |
| Immigrants | Northern Africa | 39.7 /100 | #183 | Fair 46.5% |
| Brazilians | 39.3 /100 | #184 | Fair 46.4% |
| Mongolians | 37.6 /100 | #185 | Fair 46.4% |
| Immigrants | Chile | 36.8 /100 | #186 | Fair 46.4% |
| Immigrants | Peru | 35.3 /100 | #187 | Fair 46.4% |
| Colombians | 31.8 /100 | #188 | Fair 46.3% |
| Fijians | 30.3 /100 | #189 | Fair 46.3% |
| Choctaw | 29.1 /100 | #190 | Fair 46.3% |
| Immigrants | France | 27.7 /100 | #191 | Fair 46.2% |
| Soviet Union | 25.7 /100 | #192 | Fair 46.2% |
| Immigrants | Fiji | 25.0 /100 | #193 | Fair 46.2% |
| South Americans | 23.8 /100 | #194 | Fair 46.1% |
| Immigrants | Nepal | 23.7 /100 | #195 | Fair 46.1% |
| Immigrants | Bosnia and Herzegovina | 22.2 /100 | #196 | Fair 46.1% |
| Immigrants | Kuwait | 21.7 /100 | #197 | Fair 46.1% |
Demographics Similar to Immigrants from Austria by Currently Married
In terms of currently married, the demographic groups most similar to Immigrants from Austria are Immigrants from Moldova (48.5%, a difference of 0.060%), Immigrants from North Macedonia (48.5%, a difference of 0.070%), Latvian (48.5%, a difference of 0.070%), Immigrants from Netherlands (48.5%, a difference of 0.10%), and Russian (48.6%, a difference of 0.12%).
| Demographics | Rating | Rank | Currently Married |
| Immigrants | Iran | 99.2 /100 | #46 | Exceptional 48.7% |
| Northern Europeans | 99.2 /100 | #47 | Exceptional 48.7% |
| Austrians | 99.2 /100 | #48 | Exceptional 48.7% |
| Bhutanese | 99.1 /100 | #49 | Exceptional 48.6% |
| Iranians | 99.0 /100 | #50 | Exceptional 48.6% |
| Whites/Caucasians | 99.0 /100 | #51 | Exceptional 48.6% |
| Russians | 98.9 /100 | #52 | Exceptional 48.6% |
| Immigrants | Austria | 98.8 /100 | #53 | Exceptional 48.5% |
| Immigrants | Moldova | 98.7 /100 | #54 | Exceptional 48.5% |
| Immigrants | North Macedonia | 98.7 /100 | #55 | Exceptional 48.5% |
| Latvians | 98.7 /100 | #56 | Exceptional 48.5% |
| Immigrants | Netherlands | 98.6 /100 | #57 | Exceptional 48.5% |
| French | 98.6 /100 | #58 | Exceptional 48.4% |
| Immigrants | Ireland | 98.5 /100 | #59 | Exceptional 48.4% |
| Immigrants | Romania | 98.5 /100 | #60 | Exceptional 48.4% |