Choctaw vs Immigrants from Ghana Unemployment Among Women with Children Under 6 years
COMPARE
Choctaw
Immigrants from Ghana
Unemployment Among Women with Children Under 6 years
Unemployment Among Women with Children Under 6 years Comparison
Choctaw
Immigrants from Ghana
9.8%
UNEMPLOYMENT AMONG WOMEN WITH CHILDREN UNDER 6 YEARS
0.0/ 100
METRIC RATING
325th/ 347
METRIC RANK
8.3%
UNEMPLOYMENT AMONG WOMEN WITH CHILDREN UNDER 6 YEARS
0.5/ 100
METRIC RATING
258th/ 347
METRIC RANK
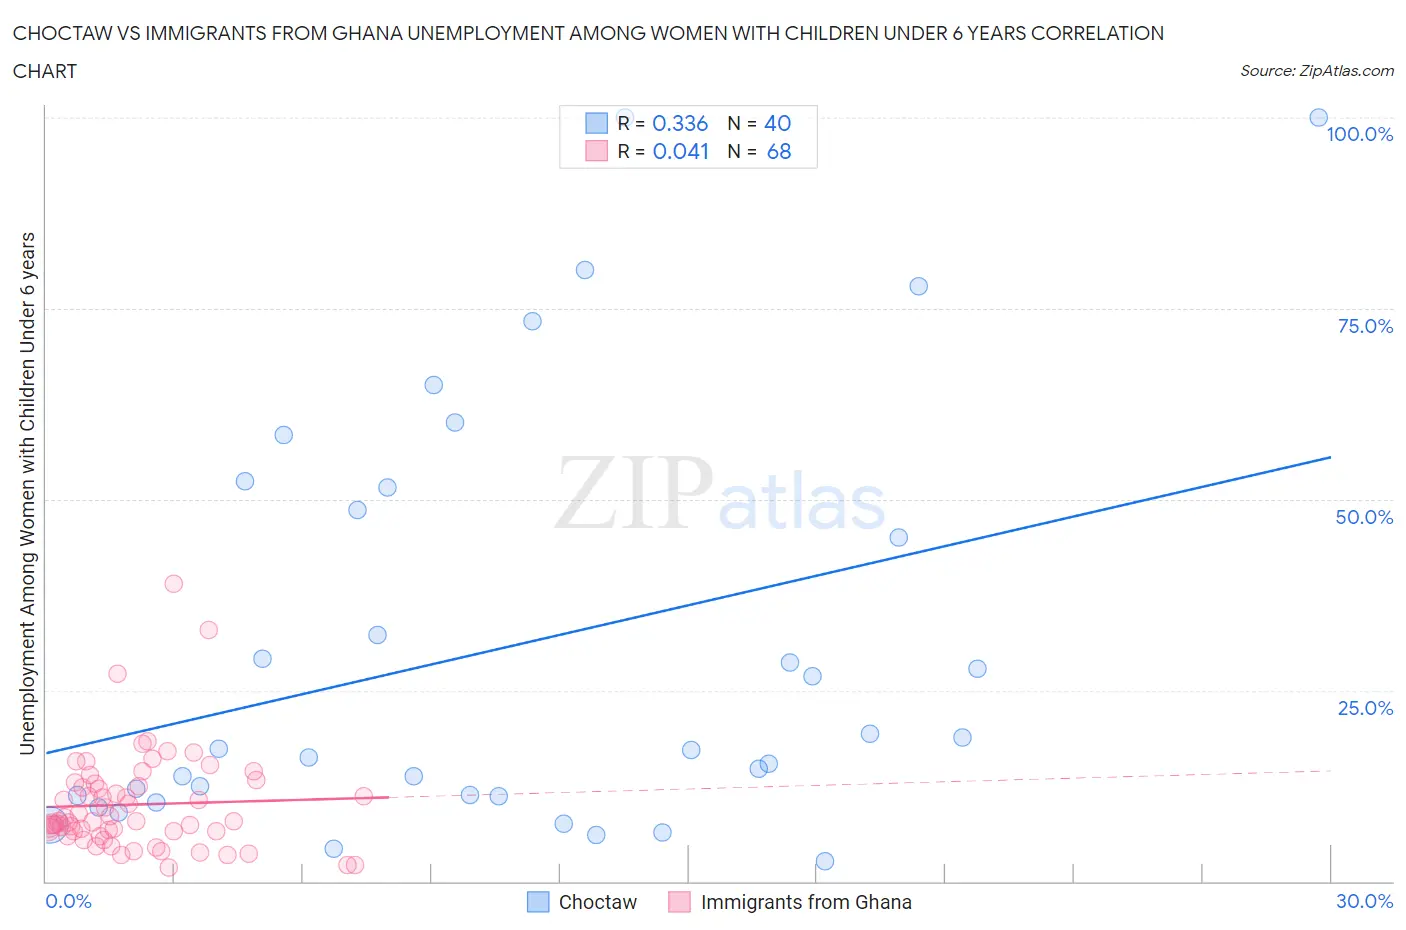
Choctaw vs Immigrants from Ghana Unemployment Among Women with Children Under 6 years Correlation Chart
The statistical analysis conducted on geographies consisting of 218,001,226 people shows a mild positive correlation between the proportion of Choctaw and unemployment rate among women with children under the age of 6 in the United States with a correlation coefficient (R) of 0.336 and weighted average of 9.8%. Similarly, the statistical analysis conducted on geographies consisting of 171,977,203 people shows no correlation between the proportion of Immigrants from Ghana and unemployment rate among women with children under the age of 6 in the United States with a correlation coefficient (R) of 0.041 and weighted average of 8.3%, a difference of 17.7%.
Unemployment Among Women with Children Under 6 years Correlation Summary
| Measurement | Choctaw | Immigrants from Ghana |
| Minimum | 2.6% | 1.8% |
| Maximum | 100.0% | 39.0% |
| Range | 97.4% | 37.2% |
| Mean | 30.6% | 10.0% |
| Median | 17.3% | 7.9% |
| Interquartile 25% (IQ1) | 11.2% | 6.5% |
| Interquartile 75% (IQ3) | 50.1% | 12.6% |
| Interquartile Range (IQR) | 38.9% | 6.1% |
| Standard Deviation (Sample) | 27.3% | 6.6% |
| Standard Deviation (Population) | 27.0% | 6.5% |
Similar Demographics by Unemployment Among Women with Children Under 6 years
Demographics Similar to Choctaw by Unemployment Among Women with Children Under 6 years
In terms of unemployment among women with children under 6 years, the demographic groups most similar to Choctaw are Delaware (9.8%, a difference of 0.030%), Ottawa (9.9%, a difference of 0.83%), Paiute (9.7%, a difference of 0.95%), Immigrants from Bahamas (9.6%, a difference of 1.7%), and Alaska Native (9.6%, a difference of 1.8%).
| Demographics | Rating | Rank | Unemployment Among Women with Children Under 6 years |
| Osage | 0.0 /100 | #318 | Tragic 9.5% |
| Marshallese | 0.0 /100 | #319 | Tragic 9.6% |
| Potawatomi | 0.0 /100 | #320 | Tragic 9.6% |
| Central American Indians | 0.0 /100 | #321 | Tragic 9.6% |
| Alaska Natives | 0.0 /100 | #322 | Tragic 9.6% |
| Immigrants | Bahamas | 0.0 /100 | #323 | Tragic 9.6% |
| Paiute | 0.0 /100 | #324 | Tragic 9.7% |
| Choctaw | 0.0 /100 | #325 | Tragic 9.8% |
| Delaware | 0.0 /100 | #326 | Tragic 9.8% |
| Ottawa | 0.0 /100 | #327 | Tragic 9.9% |
| Tohono O'odham | 0.0 /100 | #328 | Tragic 10.2% |
| Blacks/African Americans | 0.0 /100 | #329 | Tragic 10.3% |
| Pennsylvania Germans | 0.0 /100 | #330 | Tragic 10.8% |
| Colville | 0.0 /100 | #331 | Tragic 11.2% |
| Sioux | 0.0 /100 | #332 | Tragic 11.5% |
Demographics Similar to Immigrants from Ghana by Unemployment Among Women with Children Under 6 years
In terms of unemployment among women with children under 6 years, the demographic groups most similar to Immigrants from Ghana are British West Indian (8.3%, a difference of 0.020%), Celtic (8.3%, a difference of 0.28%), Barbadian (8.3%, a difference of 0.29%), Immigrants from Portugal (8.3%, a difference of 0.30%), and White/Caucasian (8.4%, a difference of 0.55%).
| Demographics | Rating | Rank | Unemployment Among Women with Children Under 6 years |
| Guyanese | 1.0 /100 | #251 | Tragic 8.2% |
| Ghanaians | 1.0 /100 | #252 | Tragic 8.2% |
| Immigrants | Guyana | 0.8 /100 | #253 | Tragic 8.2% |
| Immigrants | Caribbean | 0.7 /100 | #254 | Tragic 8.3% |
| Immigrants | Portugal | 0.6 /100 | #255 | Tragic 8.3% |
| Celtics | 0.6 /100 | #256 | Tragic 8.3% |
| British West Indians | 0.5 /100 | #257 | Tragic 8.3% |
| Immigrants | Ghana | 0.5 /100 | #258 | Tragic 8.3% |
| Barbadians | 0.4 /100 | #259 | Tragic 8.3% |
| Whites/Caucasians | 0.3 /100 | #260 | Tragic 8.4% |
| Immigrants | Liberia | 0.3 /100 | #261 | Tragic 8.4% |
| West Indians | 0.3 /100 | #262 | Tragic 8.4% |
| Scotch-Irish | 0.3 /100 | #263 | Tragic 8.4% |
| Hondurans | 0.3 /100 | #264 | Tragic 8.4% |
| French Canadians | 0.3 /100 | #265 | Tragic 8.4% |