Choctaw vs Sri Lankan Births to Unmarried Women
COMPARE
Choctaw
Sri Lankan
Births to Unmarried Women
Births to Unmarried Women Comparison
Choctaw
Sri Lankans
36.9%
BIRTHS TO UNMARRIED WOMEN
0.1/ 100
METRIC RATING
272nd/ 347
METRIC RANK
28.9%
BIRTHS TO UNMARRIED WOMEN
97.5/ 100
METRIC RATING
85th/ 347
METRIC RANK
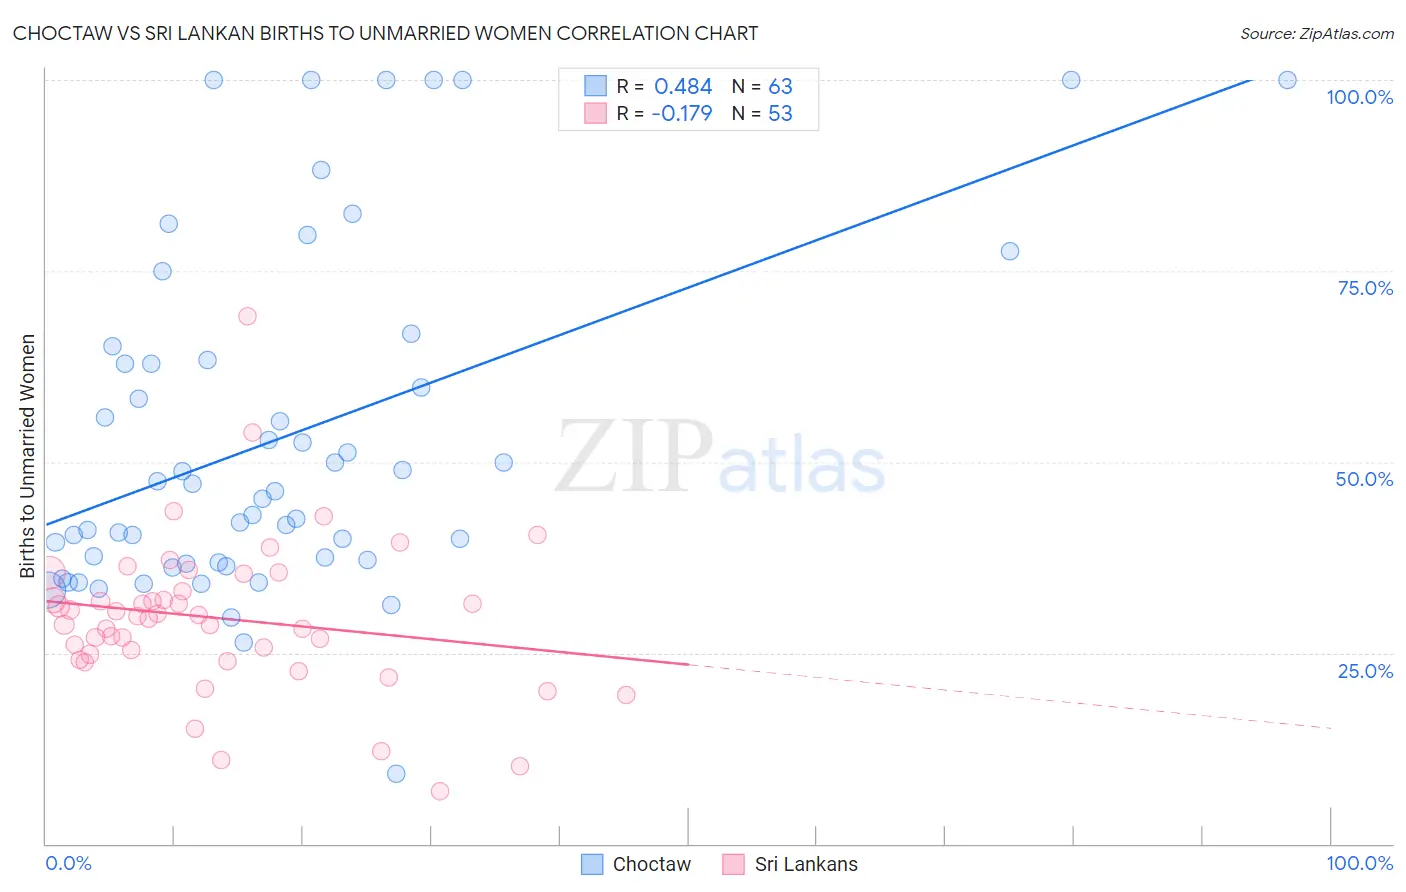
Choctaw vs Sri Lankan Births to Unmarried Women Correlation Chart
The statistical analysis conducted on geographies consisting of 258,635,203 people shows a moderate positive correlation between the proportion of Choctaw and percentage of births to unmarried women in the United States with a correlation coefficient (R) of 0.484 and weighted average of 36.9%. Similarly, the statistical analysis conducted on geographies consisting of 411,137,985 people shows a poor negative correlation between the proportion of Sri Lankans and percentage of births to unmarried women in the United States with a correlation coefficient (R) of -0.179 and weighted average of 28.9%, a difference of 27.4%.
Births to Unmarried Women Correlation Summary
| Measurement | Choctaw | Sri Lankan |
| Minimum | 9.1% | 6.9% |
| Maximum | 100.0% | 69.0% |
| Range | 90.9% | 62.1% |
| Mean | 53.2% | 29.5% |
| Median | 46.2% | 29.7% |
| Interquartile 25% (IQ1) | 36.9% | 24.4% |
| Interquartile 75% (IQ3) | 63.4% | 34.2% |
| Interquartile Range (IQR) | 26.5% | 9.8% |
| Standard Deviation (Sample) | 22.4% | 10.2% |
| Standard Deviation (Population) | 22.2% | 10.1% |
Similar Demographics by Births to Unmarried Women
Demographics Similar to Choctaw by Births to Unmarried Women
In terms of births to unmarried women, the demographic groups most similar to Choctaw are Mexican (36.9%, a difference of 0.12%), Cree (37.0%, a difference of 0.21%), Immigrants from Barbados (36.8%, a difference of 0.22%), Barbadian (37.0%, a difference of 0.23%), and Immigrants from Congo (36.8%, a difference of 0.24%).
| Demographics | Rating | Rank | Births to Unmarried Women |
| Cherokee | 0.1 /100 | #265 | Tragic 36.7% |
| Immigrants | Senegal | 0.1 /100 | #266 | Tragic 36.7% |
| Central Americans | 0.1 /100 | #267 | Tragic 36.7% |
| Comanche | 0.1 /100 | #268 | Tragic 36.7% |
| Senegalese | 0.1 /100 | #269 | Tragic 36.8% |
| Immigrants | Congo | 0.1 /100 | #270 | Tragic 36.8% |
| Immigrants | Barbados | 0.1 /100 | #271 | Tragic 36.8% |
| Choctaw | 0.1 /100 | #272 | Tragic 36.9% |
| Mexicans | 0.1 /100 | #273 | Tragic 36.9% |
| Cree | 0.1 /100 | #274 | Tragic 37.0% |
| Barbadians | 0.1 /100 | #275 | Tragic 37.0% |
| Belizeans | 0.1 /100 | #276 | Tragic 37.0% |
| Guatemalans | 0.1 /100 | #277 | Tragic 37.1% |
| Immigrants | Latin America | 0.1 /100 | #278 | Tragic 37.1% |
| West Indians | 0.1 /100 | #279 | Tragic 37.3% |
Demographics Similar to Sri Lankans by Births to Unmarried Women
In terms of births to unmarried women, the demographic groups most similar to Sri Lankans are Immigrants from Jordan (29.0%, a difference of 0.070%), Taiwanese (29.0%, a difference of 0.15%), Immigrants from France (29.0%, a difference of 0.16%), Immigrants from Poland (28.9%, a difference of 0.17%), and Immigrants from Saudi Arabia (29.1%, a difference of 0.43%).
| Demographics | Rating | Rank | Births to Unmarried Women |
| Zimbabweans | 98.2 /100 | #78 | Exceptional 28.7% |
| Danes | 98.2 /100 | #79 | Exceptional 28.7% |
| Immigrants | Afghanistan | 98.1 /100 | #80 | Exceptional 28.7% |
| Immigrants | Austria | 98.1 /100 | #81 | Exceptional 28.7% |
| Romanians | 98.0 /100 | #82 | Exceptional 28.7% |
| Immigrants | Kuwait | 98.0 /100 | #83 | Exceptional 28.8% |
| Immigrants | Poland | 97.6 /100 | #84 | Exceptional 28.9% |
| Sri Lankans | 97.5 /100 | #85 | Exceptional 28.9% |
| Immigrants | Jordan | 97.4 /100 | #86 | Exceptional 29.0% |
| Taiwanese | 97.3 /100 | #87 | Exceptional 29.0% |
| Immigrants | France | 97.3 /100 | #88 | Exceptional 29.0% |
| Immigrants | Saudi Arabia | 97.0 /100 | #89 | Exceptional 29.1% |
| Immigrants | Latvia | 96.8 /100 | #90 | Exceptional 29.1% |
| Immigrants | Fiji | 96.6 /100 | #91 | Exceptional 29.2% |
| Arabs | 96.5 /100 | #92 | Exceptional 29.2% |