Choctaw vs Ecuadorian 9th Grade
COMPARE
Choctaw
Ecuadorian
9th Grade
9th Grade Comparison
Choctaw
Ecuadorians
95.1%
9TH GRADE
81.9/ 100
METRIC RATING
147th/ 347
METRIC RANK
91.9%
9TH GRADE
0.0/ 100
METRIC RATING
319th/ 347
METRIC RANK
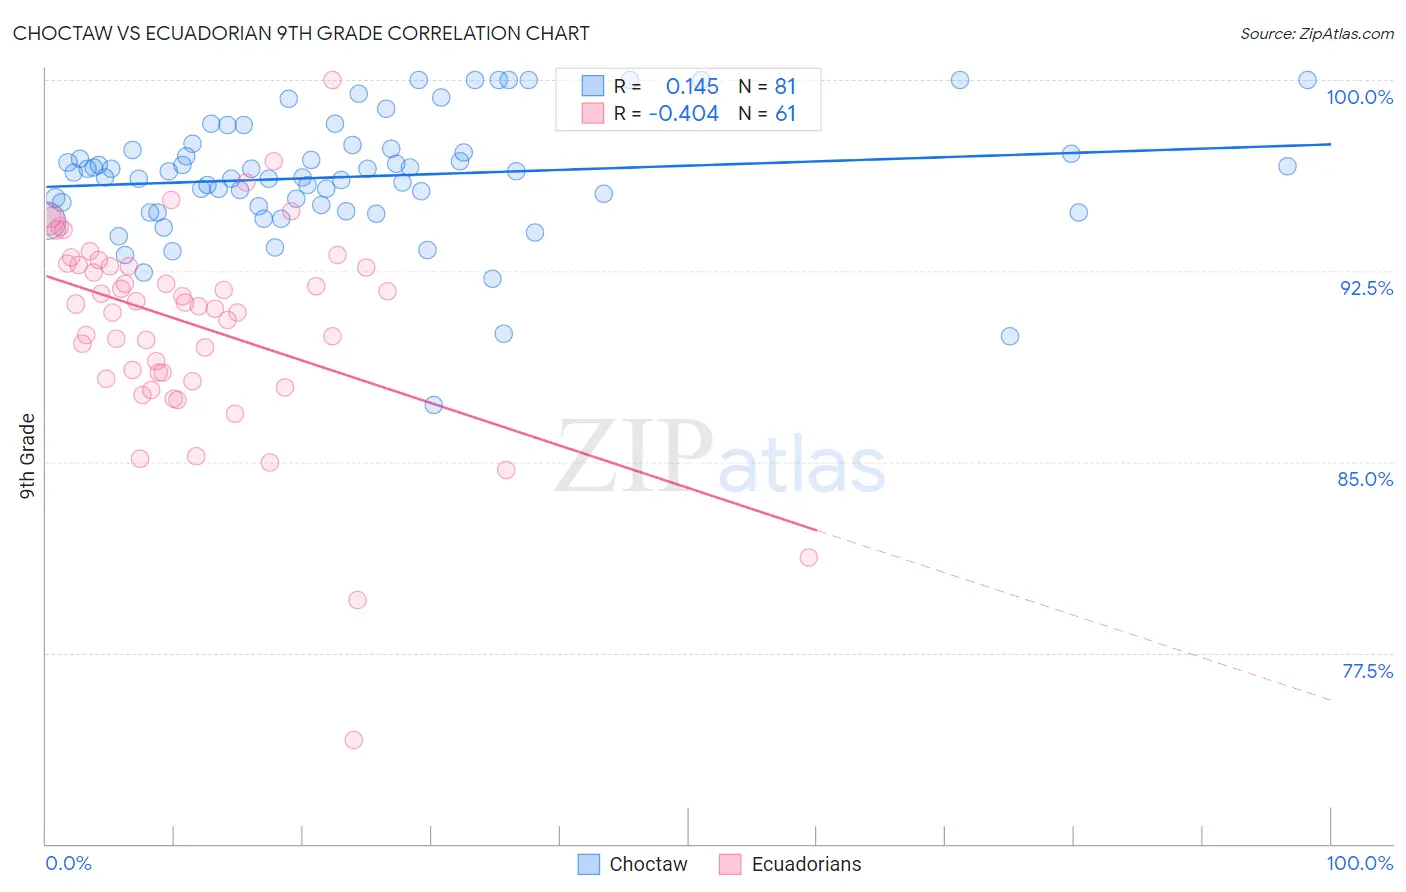
Choctaw vs Ecuadorian 9th Grade Correlation Chart
The statistical analysis conducted on geographies consisting of 269,742,875 people shows a poor positive correlation between the proportion of Choctaw and percentage of population with at least 9th grade education in the United States with a correlation coefficient (R) of 0.145 and weighted average of 95.1%. Similarly, the statistical analysis conducted on geographies consisting of 317,864,750 people shows a moderate negative correlation between the proportion of Ecuadorians and percentage of population with at least 9th grade education in the United States with a correlation coefficient (R) of -0.404 and weighted average of 91.9%, a difference of 3.5%.
9th Grade Correlation Summary
| Measurement | Choctaw | Ecuadorian |
| Minimum | 87.3% | 74.1% |
| Maximum | 100.0% | 100.0% |
| Range | 12.7% | 25.9% |
| Mean | 96.2% | 90.4% |
| Median | 96.3% | 91.2% |
| Interquartile 25% (IQ1) | 95.0% | 88.4% |
| Interquartile 75% (IQ3) | 97.3% | 92.8% |
| Interquartile Range (IQR) | 2.3% | 4.4% |
| Standard Deviation (Sample) | 2.4% | 4.1% |
| Standard Deviation (Population) | 2.4% | 4.1% |
Similar Demographics by 9th Grade
Demographics Similar to Choctaw by 9th Grade
In terms of 9th grade, the demographic groups most similar to Choctaw are Pueblo (95.1%, a difference of 0.0%), Immigrants from Sri Lanka (95.1%, a difference of 0.0%), Immigrants from Jordan (95.1%, a difference of 0.010%), Yup'ik (95.2%, a difference of 0.020%), and Spanish (95.2%, a difference of 0.030%).
| Demographics | Rating | Rank | 9th Grade |
| Immigrants | Taiwan | 85.3 /100 | #140 | Excellent 95.2% |
| Immigrants | Bosnia and Herzegovina | 85.2 /100 | #141 | Excellent 95.2% |
| Immigrants | Greece | 84.6 /100 | #142 | Excellent 95.2% |
| Spanish | 84.4 /100 | #143 | Excellent 95.2% |
| Yup'ik | 83.3 /100 | #144 | Excellent 95.2% |
| Pueblo | 82.2 /100 | #145 | Excellent 95.1% |
| Immigrants | Sri Lanka | 82.1 /100 | #146 | Excellent 95.1% |
| Choctaw | 81.9 /100 | #147 | Excellent 95.1% |
| Immigrants | Jordan | 81.2 /100 | #148 | Excellent 95.1% |
| Immigrants | Korea | 79.6 /100 | #149 | Good 95.1% |
| Kenyans | 79.1 /100 | #150 | Good 95.1% |
| Cajuns | 77.3 /100 | #151 | Good 95.1% |
| Ugandans | 77.0 /100 | #152 | Good 95.1% |
| Albanians | 76.1 /100 | #153 | Good 95.1% |
| Arabs | 74.9 /100 | #154 | Good 95.1% |
Demographics Similar to Ecuadorians by 9th Grade
In terms of 9th grade, the demographic groups most similar to Ecuadorians are Nicaraguan (91.9%, a difference of 0.040%), Nepalese (92.0%, a difference of 0.050%), Immigrants from Ecuador (91.8%, a difference of 0.11%), Belizean (91.8%, a difference of 0.13%), and Puerto Rican (91.8%, a difference of 0.14%).
| Demographics | Rating | Rank | 9th Grade |
| Houma | 0.0 /100 | #312 | Tragic 92.3% |
| Vietnamese | 0.0 /100 | #313 | Tragic 92.3% |
| Immigrants | Portugal | 0.0 /100 | #314 | Tragic 92.2% |
| Immigrants | Caribbean | 0.0 /100 | #315 | Tragic 92.2% |
| Cape Verdeans | 0.0 /100 | #316 | Tragic 92.2% |
| Immigrants | Cuba | 0.0 /100 | #317 | Tragic 92.2% |
| Nepalese | 0.0 /100 | #318 | Tragic 92.0% |
| Ecuadorians | 0.0 /100 | #319 | Tragic 91.9% |
| Nicaraguans | 0.0 /100 | #320 | Tragic 91.9% |
| Immigrants | Ecuador | 0.0 /100 | #321 | Tragic 91.8% |
| Belizeans | 0.0 /100 | #322 | Tragic 91.8% |
| Puerto Ricans | 0.0 /100 | #323 | Tragic 91.8% |
| Immigrants | Belize | 0.0 /100 | #324 | Tragic 91.8% |
| Central American Indians | 0.0 /100 | #325 | Tragic 91.5% |
| Immigrants | Armenia | 0.0 /100 | #326 | Tragic 91.4% |