Choctaw vs Immigrants from Yemen Births to Unmarried Women
COMPARE
Choctaw
Immigrants from Yemen
Births to Unmarried Women
Births to Unmarried Women Comparison
Choctaw
Immigrants from Yemen
36.9%
BIRTHS TO UNMARRIED WOMEN
0.1/ 100
METRIC RATING
272nd/ 347
METRIC RANK
31.7%
BIRTHS TO UNMARRIED WOMEN
50.2/ 100
METRIC RATING
173rd/ 347
METRIC RANK
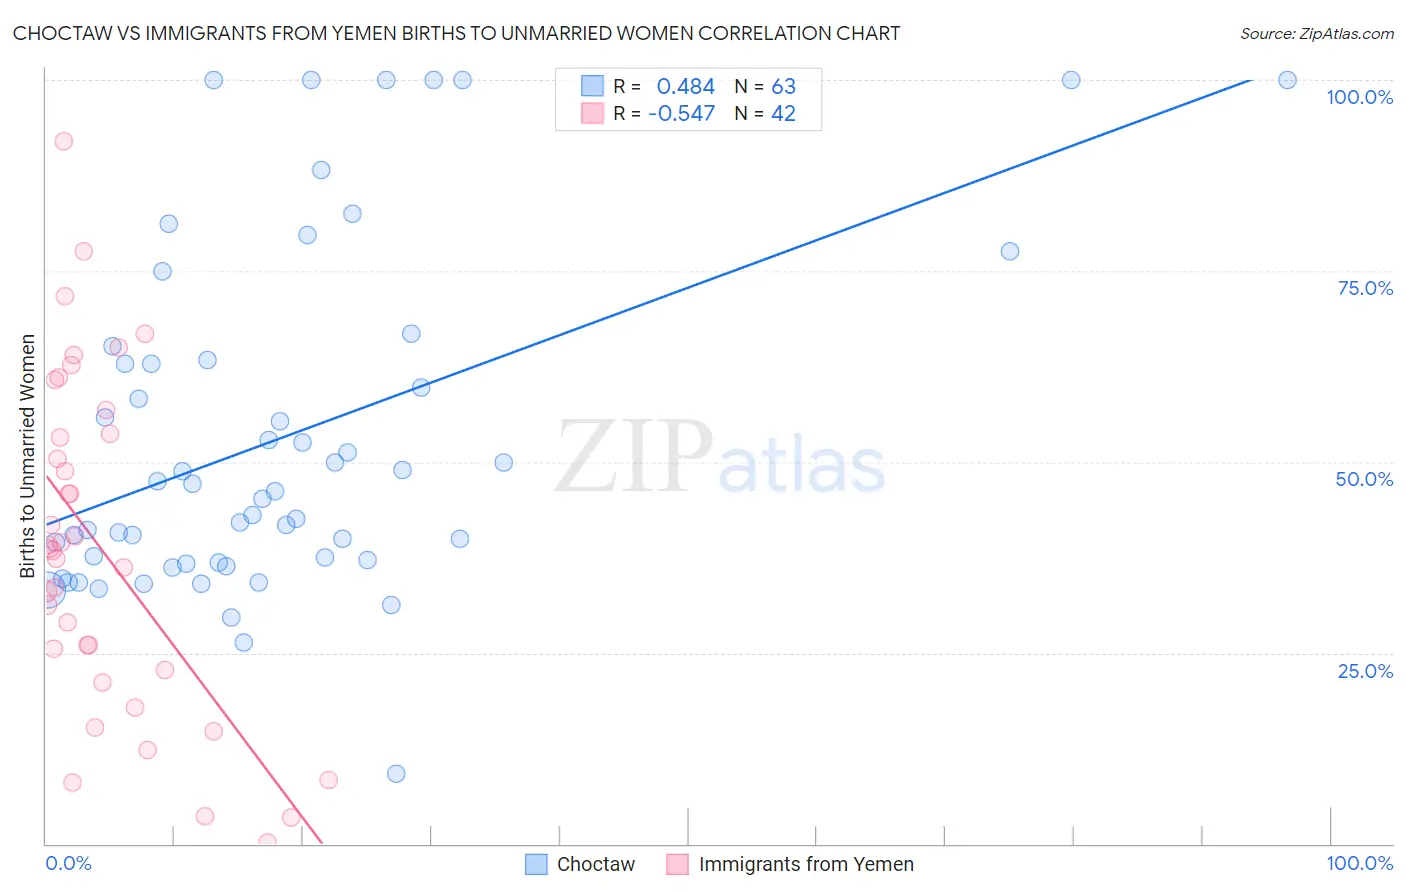
Choctaw vs Immigrants from Yemen Births to Unmarried Women Correlation Chart
The statistical analysis conducted on geographies consisting of 258,635,203 people shows a moderate positive correlation between the proportion of Choctaw and percentage of births to unmarried women in the United States with a correlation coefficient (R) of 0.484 and weighted average of 36.9%. Similarly, the statistical analysis conducted on geographies consisting of 81,136,879 people shows a substantial negative correlation between the proportion of Immigrants from Yemen and percentage of births to unmarried women in the United States with a correlation coefficient (R) of -0.547 and weighted average of 31.7%, a difference of 16.5%.
Births to Unmarried Women Correlation Summary
| Measurement | Choctaw | Immigrants from Yemen |
| Minimum | 9.1% | 0.20% |
| Maximum | 100.0% | 92.0% |
| Range | 90.9% | 91.8% |
| Mean | 53.2% | 38.5% |
| Median | 46.2% | 38.5% |
| Interquartile 25% (IQ1) | 36.9% | 22.7% |
| Interquartile 75% (IQ3) | 63.4% | 53.7% |
| Interquartile Range (IQR) | 26.5% | 31.0% |
| Standard Deviation (Sample) | 22.4% | 21.8% |
| Standard Deviation (Population) | 22.2% | 21.6% |
Similar Demographics by Births to Unmarried Women
Demographics Similar to Choctaw by Births to Unmarried Women
In terms of births to unmarried women, the demographic groups most similar to Choctaw are Mexican (36.9%, a difference of 0.12%), Cree (37.0%, a difference of 0.21%), Immigrants from Barbados (36.8%, a difference of 0.22%), Barbadian (37.0%, a difference of 0.23%), and Immigrants from Congo (36.8%, a difference of 0.24%).
| Demographics | Rating | Rank | Births to Unmarried Women |
| Cherokee | 0.1 /100 | #265 | Tragic 36.7% |
| Immigrants | Senegal | 0.1 /100 | #266 | Tragic 36.7% |
| Central Americans | 0.1 /100 | #267 | Tragic 36.7% |
| Comanche | 0.1 /100 | #268 | Tragic 36.7% |
| Senegalese | 0.1 /100 | #269 | Tragic 36.8% |
| Immigrants | Congo | 0.1 /100 | #270 | Tragic 36.8% |
| Immigrants | Barbados | 0.1 /100 | #271 | Tragic 36.8% |
| Choctaw | 0.1 /100 | #272 | Tragic 36.9% |
| Mexicans | 0.1 /100 | #273 | Tragic 36.9% |
| Cree | 0.1 /100 | #274 | Tragic 37.0% |
| Barbadians | 0.1 /100 | #275 | Tragic 37.0% |
| Belizeans | 0.1 /100 | #276 | Tragic 37.0% |
| Guatemalans | 0.1 /100 | #277 | Tragic 37.1% |
| Immigrants | Latin America | 0.1 /100 | #278 | Tragic 37.1% |
| West Indians | 0.1 /100 | #279 | Tragic 37.3% |
Demographics Similar to Immigrants from Yemen by Births to Unmarried Women
In terms of births to unmarried women, the demographic groups most similar to Immigrants from Yemen are Immigrants from Eritrea (31.7%, a difference of 0.020%), Venezuelan (31.7%, a difference of 0.020%), Finnish (31.7%, a difference of 0.030%), Guamanian/Chamorro (31.6%, a difference of 0.10%), and Immigrants from Venezuela (31.7%, a difference of 0.10%).
| Demographics | Rating | Rank | Births to Unmarried Women |
| Peruvians | 55.5 /100 | #166 | Average 31.5% |
| Dutch | 55.3 /100 | #167 | Average 31.5% |
| Belgians | 52.4 /100 | #168 | Average 31.6% |
| Slavs | 52.0 /100 | #169 | Average 31.6% |
| Guamanians/Chamorros | 51.3 /100 | #170 | Average 31.6% |
| Finns | 50.5 /100 | #171 | Average 31.7% |
| Immigrants | Eritrea | 50.4 /100 | #172 | Average 31.7% |
| Immigrants | Yemen | 50.2 /100 | #173 | Average 31.7% |
| Venezuelans | 50.0 /100 | #174 | Average 31.7% |
| Immigrants | Venezuela | 49.2 /100 | #175 | Average 31.7% |
| Scottish | 48.1 /100 | #176 | Average 31.7% |
| South American Indians | 47.7 /100 | #177 | Average 31.7% |
| English | 47.4 /100 | #178 | Average 31.7% |
| South Americans | 46.9 /100 | #179 | Average 31.8% |
| Moroccans | 45.7 /100 | #180 | Average 31.8% |