Chilean vs Italian Child Poverty Under the Age of 5
COMPARE
Chilean
Italian
Child Poverty Under the Age of 5
Child Poverty Under the Age of 5 Comparison
Chileans
Italians
15.6%
CHILD POVERTY UNDER THE AGE OF 5
97.6/ 100
METRIC RATING
83rd/ 347
METRIC RANK
15.5%
CHILD POVERTY UNDER THE AGE OF 5
97.9/ 100
METRIC RATING
80th/ 347
METRIC RANK
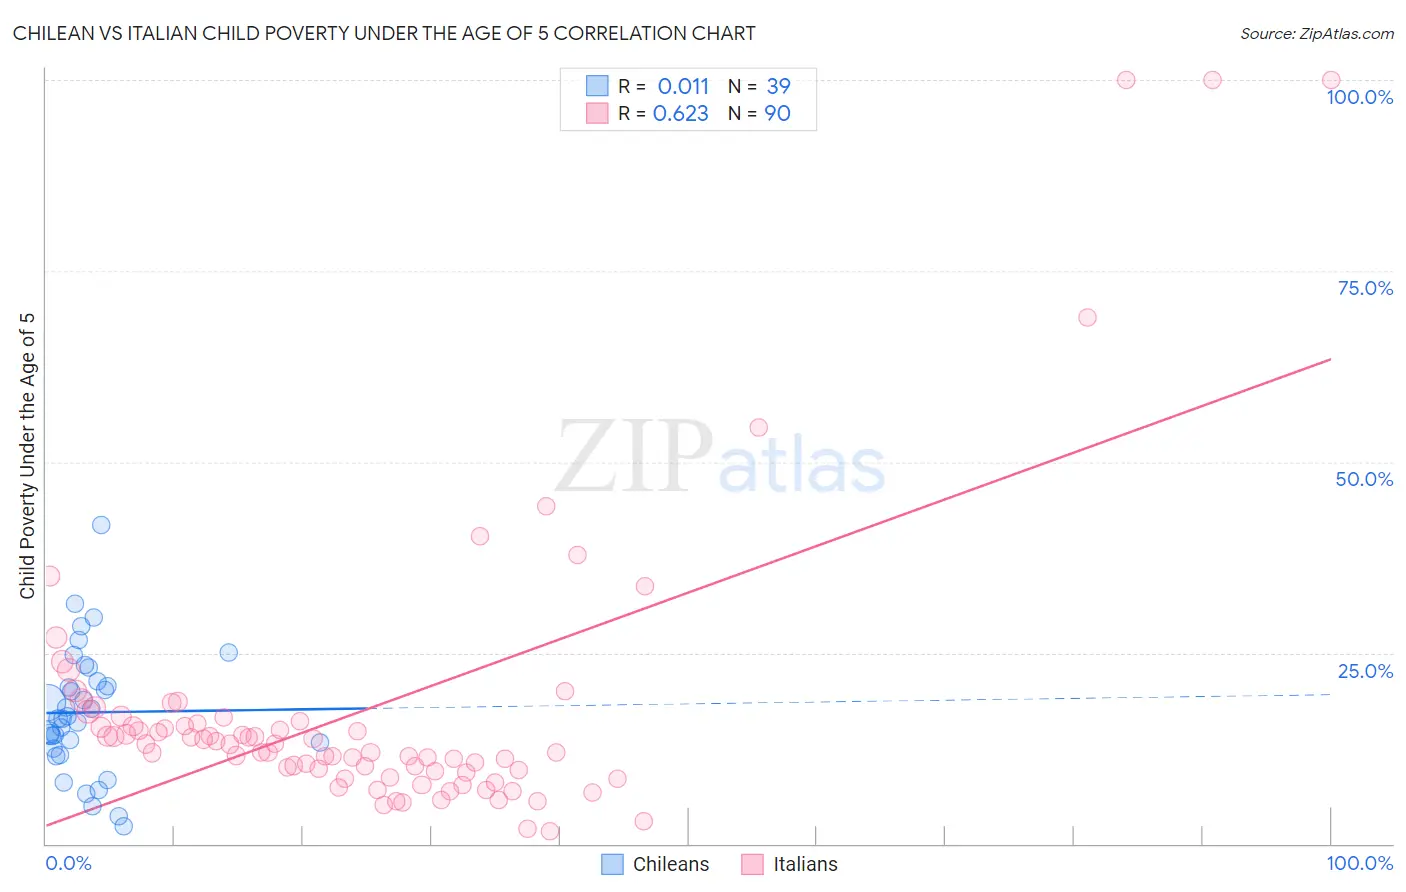
Chilean vs Italian Child Poverty Under the Age of 5 Correlation Chart
The statistical analysis conducted on geographies consisting of 249,794,467 people shows no correlation between the proportion of Chileans and poverty level among children under the age of 5 in the United States with a correlation coefficient (R) of 0.011 and weighted average of 15.6%. Similarly, the statistical analysis conducted on geographies consisting of 533,440,321 people shows a significant positive correlation between the proportion of Italians and poverty level among children under the age of 5 in the United States with a correlation coefficient (R) of 0.623 and weighted average of 15.5%, a difference of 0.41%.
Child Poverty Under the Age of 5 Correlation Summary
| Measurement | Chilean | Italian |
| Minimum | 2.3% | 1.6% |
| Maximum | 41.7% | 100.0% |
| Range | 39.4% | 98.4% |
| Mean | 17.2% | 17.5% |
| Median | 16.3% | 13.0% |
| Interquartile 25% (IQ1) | 12.4% | 9.6% |
| Interquartile 75% (IQ3) | 21.3% | 16.0% |
| Interquartile Range (IQR) | 8.9% | 6.4% |
| Standard Deviation (Sample) | 8.1% | 18.6% |
| Standard Deviation (Population) | 8.0% | 18.5% |
Demographics Similar to Chileans and Italians by Child Poverty Under the Age of 5
In terms of child poverty under the age of 5, the demographic groups most similar to Chileans are Immigrants from Netherlands (15.6%, a difference of 0.020%), Immigrants from Italy (15.6%, a difference of 0.16%), Immigrants from Latvia (15.6%, a difference of 0.18%), Immigrants from Malaysia (15.6%, a difference of 0.18%), and Immigrants from Vietnam (15.6%, a difference of 0.26%). Similarly, the demographic groups most similar to Italians are Australian (15.5%, a difference of 0.11%), Czech (15.5%, a difference of 0.11%), Immigrants from Italy (15.6%, a difference of 0.25%), Sri Lankan (15.5%, a difference of 0.37%), and Immigrants from Netherlands (15.6%, a difference of 0.43%).
| Demographics | Rating | Rank | Child Poverty Under the Age of 5 |
| Immigrants | Egypt | 98.8 /100 | #71 | Exceptional 15.3% |
| Immigrants | Sweden | 98.8 /100 | #72 | Exceptional 15.3% |
| Immigrants | Ukraine | 98.7 /100 | #73 | Exceptional 15.3% |
| Argentineans | 98.5 /100 | #74 | Exceptional 15.4% |
| Immigrants | Argentina | 98.5 /100 | #75 | Exceptional 15.4% |
| Croatians | 98.5 /100 | #76 | Exceptional 15.4% |
| Immigrants | Turkey | 98.3 /100 | #77 | Exceptional 15.4% |
| Sri Lankans | 98.1 /100 | #78 | Exceptional 15.5% |
| Australians | 98.0 /100 | #79 | Exceptional 15.5% |
| Italians | 97.9 /100 | #80 | Exceptional 15.5% |
| Czechs | 97.8 /100 | #81 | Exceptional 15.5% |
| Immigrants | Italy | 97.7 /100 | #82 | Exceptional 15.6% |
| Chileans | 97.6 /100 | #83 | Exceptional 15.6% |
| Immigrants | Netherlands | 97.6 /100 | #84 | Exceptional 15.6% |
| Immigrants | Latvia | 97.4 /100 | #85 | Exceptional 15.6% |
| Immigrants | Malaysia | 97.4 /100 | #86 | Exceptional 15.6% |
| Immigrants | Vietnam | 97.4 /100 | #87 | Exceptional 15.6% |
| Jordanians | 97.3 /100 | #88 | Exceptional 15.6% |
| Immigrants | Croatia | 97.3 /100 | #89 | Exceptional 15.6% |
| Immigrants | France | 97.3 /100 | #90 | Exceptional 15.6% |
| Poles | 97.2 /100 | #91 | Exceptional 15.7% |