Chilean vs Immigrants from Bangladesh Married-couple Households
COMPARE
Chilean
Immigrants from Bangladesh
Married-couple Households
Married-couple Households Comparison
Chileans
Immigrants from Bangladesh
47.5%
MARRIED-COUPLE HOUSEHOLDS
92.2/ 100
METRIC RATING
119th/ 347
METRIC RANK
43.1%
MARRIED-COUPLE HOUSEHOLDS
0.0/ 100
METRIC RATING
275th/ 347
METRIC RANK
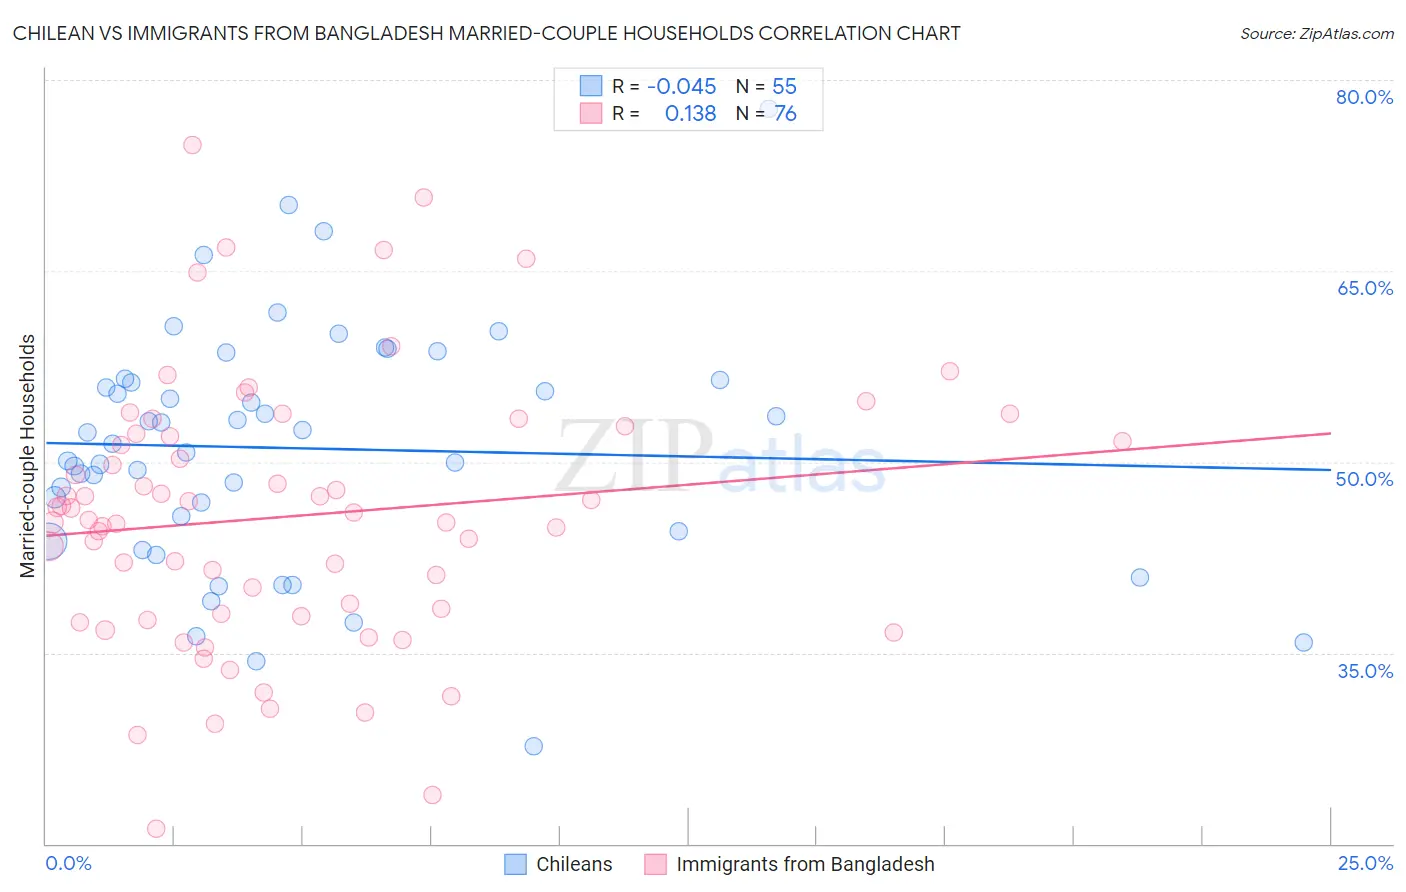
Chilean vs Immigrants from Bangladesh Married-couple Households Correlation Chart
The statistical analysis conducted on geographies consisting of 256,556,346 people shows no correlation between the proportion of Chileans and percentage of married-couple family households in the United States with a correlation coefficient (R) of -0.045 and weighted average of 47.5%. Similarly, the statistical analysis conducted on geographies consisting of 203,568,346 people shows a poor positive correlation between the proportion of Immigrants from Bangladesh and percentage of married-couple family households in the United States with a correlation coefficient (R) of 0.138 and weighted average of 43.1%, a difference of 10.3%.
Married-couple Households Correlation Summary
| Measurement | Chilean | Immigrants from Bangladesh |
| Minimum | 27.7% | 21.2% |
| Maximum | 77.8% | 74.9% |
| Range | 50.1% | 53.7% |
| Mean | 51.1% | 45.7% |
| Median | 51.4% | 45.7% |
| Interquartile 25% (IQ1) | 44.6% | 38.0% |
| Interquartile 75% (IQ3) | 56.4% | 52.1% |
| Interquartile Range (IQR) | 11.8% | 14.1% |
| Standard Deviation (Sample) | 9.4% | 10.5% |
| Standard Deviation (Population) | 9.3% | 10.4% |
Similar Demographics by Married-couple Households
Demographics Similar to Chileans by Married-couple Households
In terms of married-couple households, the demographic groups most similar to Chileans are French Canadian (47.5%, a difference of 0.030%), Immigrants from Germany (47.5%, a difference of 0.030%), Argentinean (47.5%, a difference of 0.050%), Slovak (47.6%, a difference of 0.10%), and Puget Sound Salish (47.4%, a difference of 0.19%).
| Demographics | Rating | Rank | Married-couple Households |
| Peruvians | 93.8 /100 | #112 | Exceptional 47.6% |
| Venezuelans | 93.8 /100 | #113 | Exceptional 47.6% |
| Immigrants | Europe | 93.7 /100 | #114 | Exceptional 47.6% |
| Slovaks | 92.9 /100 | #115 | Exceptional 47.6% |
| Argentineans | 92.5 /100 | #116 | Exceptional 47.5% |
| French Canadians | 92.4 /100 | #117 | Exceptional 47.5% |
| Immigrants | Germany | 92.4 /100 | #118 | Exceptional 47.5% |
| Chileans | 92.2 /100 | #119 | Exceptional 47.5% |
| Puget Sound Salish | 90.5 /100 | #120 | Exceptional 47.4% |
| Immigrants | Eastern Europe | 90.3 /100 | #121 | Exceptional 47.4% |
| Okinawans | 90.1 /100 | #122 | Exceptional 47.4% |
| Immigrants | Venezuela | 89.3 /100 | #123 | Excellent 47.4% |
| Zimbabweans | 89.2 /100 | #124 | Excellent 47.4% |
| Australians | 89.0 /100 | #125 | Excellent 47.4% |
| Pakistanis | 88.6 /100 | #126 | Excellent 47.3% |
Demographics Similar to Immigrants from Bangladesh by Married-couple Households
In terms of married-couple households, the demographic groups most similar to Immigrants from Bangladesh are Immigrants from Ethiopia (43.1%, a difference of 0.11%), Nigerian (43.2%, a difference of 0.14%), Ethiopian (43.2%, a difference of 0.15%), Immigrants from Nigeria (43.2%, a difference of 0.25%), and Guatemalan (43.3%, a difference of 0.35%).
| Demographics | Rating | Rank | Married-couple Households |
| Immigrants | Burma/Myanmar | 0.1 /100 | #268 | Tragic 43.4% |
| Immigrants | Sierra Leone | 0.1 /100 | #269 | Tragic 43.3% |
| Yuman | 0.1 /100 | #270 | Tragic 43.3% |
| Guatemalans | 0.1 /100 | #271 | Tragic 43.3% |
| Immigrants | Nigeria | 0.1 /100 | #272 | Tragic 43.2% |
| Ethiopians | 0.1 /100 | #273 | Tragic 43.2% |
| Nigerians | 0.1 /100 | #274 | Tragic 43.2% |
| Immigrants | Bangladesh | 0.0 /100 | #275 | Tragic 43.1% |
| Immigrants | Ethiopia | 0.0 /100 | #276 | Tragic 43.1% |
| Immigrants | Eastern Africa | 0.0 /100 | #277 | Tragic 42.9% |
| Immigrants | Africa | 0.0 /100 | #278 | Tragic 42.9% |
| Sierra Leoneans | 0.0 /100 | #279 | Tragic 42.9% |
| Immigrants | Ecuador | 0.0 /100 | #280 | Tragic 42.9% |
| Immigrants | Guatemala | 0.0 /100 | #281 | Tragic 42.8% |
| Bermudans | 0.0 /100 | #282 | Tragic 42.4% |