Chilean vs Immigrants from South Eastern Asia Married-couple Households

COMPARE

Chilean
Race
Ancestry
AfghanAfricanAlaska NativeAlaskan AthabascanAlbanianAleutAlsatianAmericanApacheArabArapahoArgentineanArmenianAssyrian/Chaldean/SyriacAustralianAustrianBahamianBangladeshiBarbadianBasqueBelgianBelizeanBermudanBhutaneseBlackfeetBolivianBrazilianBritishBritish West IndianBulgarianBurmeseCajunCambodianCanadianCape VerdeanCarpatho RusynCelticCentral AmericanCentral American IndianCherokeeCheyenneChickasawChileanChineseChippewaChoctawColombianColvilleComancheCosta RicanCreeCreekCroatianCrowCubanCypriotCzechCzechoslovakianDanishDelawareDominicanDutchDutch West IndianEastern EuropeanEcuadorianEgyptianEnglishEstonianEthiopianEuropeanFijianFilipinoFinnishFrenchFrench American IndianFrench CanadianGermanGerman RussianGhanaianGreekGuamanian/ChamorroGuatemalanGuyaneseHaitianHmongHonduranHopiHoumaHungarianIcelanderIndian (Asian)IndonesianInupiatIranianIraqiIrishIroquoisIsraeliItalianJamaicanJapaneseJordanianKenyanKiowaKoreanLaotianLatvianLebaneseLiberianLithuanianLumbeeLuxembourgerMacedonianMalaysianMalteseMarshalleseMenomineeMexicanMexican American IndianMongolianMoroccanNative HawaiianNavajoNepaleseNew ZealanderNicaraguanNigerianNorthern EuropeanNorwegianOkinawanOsageOttawaPaiutePakistaniPalestinianPanamanianParaguayanPennsylvania GermanPeruvianPimaPolishPortuguesePotawatomiPuebloPuerto RicanPuget Sound SalishRomanianRussianSalvadoranSamoanScandinavianScotch-IrishScottishSeminoleSenegaleseSerbianShoshoneSierra LeoneanSiouxSlavicSlovakSloveneSomaliSouth AfricanSouth AmericanSouth American IndianSoviet UnionSpaniardSpanishSpanish AmericanSpanish American IndianSri LankanSubsaharan AfricanSudaneseSwedishSwissSyrianTaiwaneseThaiTlingit-HaidaTohono O'OdhamTonganTrinidadian and TobagonianTsimshianTurkishU.S. Virgin IslanderUgandanUkrainianUruguayanUteVenezuelanVietnameseWelshWest IndianYakamaYaquiYugoslavianYumanYup'ikZimbabwean
Immigration
NonimmigrantsImmigrantsAfghanistanAfricaAlbaniaArgentinaArmeniaAsiaAustraliaAustriaBahamasBangladeshBarbadosBelarusBelgiumBelizeBoliviaBosnia and HerzegovinaBrazilBulgariaBurma/MyanmarCabo VerdeCambodiaCameroonCanadaCaribbeanCentral AmericaChileChinaColombiaCongoCosta RicaCroatiaCubaCzechoslovakiaDenmarkDominicaDominican RepublicEastern AfricaEastern AsiaEastern EuropeEcuadorEgyptEl SalvadorEnglandEritreaEthiopiaEuropeFijiFranceGermanyGhanaGreeceGrenadaGuatemalaGuyanaHaitiHondurasHong KongHungaryIndiaIndonesiaIranIraqIrelandIsraelItalyJamaicaJapanJordanKazakhstanKenyaKoreaKuwaitLaosLatin AmericaLatviaLebanonLiberiaLithuaniaMalaysiaMexicoMicronesiaMiddle AfricaMoldovaMoroccoNepalNetherlandsNicaraguaNigeriaNorth AmericaNorth MacedoniaNorthern AfricaNorthern EuropeNorwayOceaniaPakistanPanamaPeruPhilippinesPolandPortugalRomaniaRussiaSaudi ArabiaScotlandSenegalSerbiaSierra LeoneSingaporeSomaliaSouth AfricaSouth AmericaSouth Central AsiaSouthern EuropeSpainSri LankaSt. Vincent and the GrenadinesSudanSwedenSwitzerlandSyriaTaiwanThailandTrinidad and TobagoTurkeyUgandaUkraineUruguayUzbekistanVenezuelaVietnamWest IndiesWestern AfricaWestern AsiaWestern EuropeYemenZaireZimbabweAzores
Immigrants from South Eastern Asia
Race
Ancestry
AfghanAfricanAlaska NativeAlaskan AthabascanAlbanianAleutAlsatianAmericanApacheArabArapahoArgentineanArmenianAssyrian/Chaldean/SyriacAustralianAustrianBahamianBangladeshiBarbadianBasqueBelgianBelizeanBermudanBhutaneseBlackfeetBolivianBrazilianBritishBritish West IndianBulgarianBurmeseCajunCambodianCanadianCape VerdeanCarpatho RusynCelticCentral AmericanCentral American IndianCherokeeCheyenneChickasawChineseChippewaChoctawColombianColvilleComancheCosta RicanCreeCreekCroatianCrowCubanCypriotCzechCzechoslovakianDanishDelawareDominicanDutchDutch West IndianEastern EuropeanEcuadorianEgyptianEnglishEstonianEthiopianEuropeanFijianFilipinoFinnishFrenchFrench American IndianFrench CanadianGermanGerman RussianGhanaianGreekGuamanian/ChamorroGuatemalanGuyaneseHaitianHmongHonduranHopiHoumaHungarianIcelanderIndian (Asian)IndonesianInupiatIranianIraqiIrishIroquoisIsraeliItalianJamaicanJapaneseJordanianKenyanKiowaKoreanLaotianLatvianLebaneseLiberianLithuanianLumbeeLuxembourgerMacedonianMalaysianMalteseMarshalleseMenomineeMexicanMexican American IndianMongolianMoroccanNative HawaiianNavajoNepaleseNew ZealanderNicaraguanNigerianNorthern EuropeanNorwegianOkinawanOsageOttawaPaiutePakistaniPalestinianPanamanianParaguayanPennsylvania GermanPeruvianPimaPolishPortuguesePotawatomiPuebloPuerto RicanPuget Sound SalishRomanianRussianSalvadoranSamoanScandinavianScotch-IrishScottishSeminoleSenegaleseSerbianShoshoneSierra LeoneanSiouxSlavicSlovakSloveneSomaliSouth AfricanSouth AmericanSouth American IndianSoviet UnionSpaniardSpanishSpanish AmericanSpanish American IndianSri LankanSubsaharan AfricanSudaneseSwedishSwissSyrianTaiwaneseThaiTlingit-HaidaTohono O'OdhamTonganTrinidadian and TobagonianTsimshianTurkishU.S. Virgin IslanderUgandanUkrainianUruguayanUteVenezuelanVietnameseWelshWest IndianYakamaYaquiYugoslavianYumanYup'ikZimbabwean
Immigration
NonimmigrantsImmigrantsAfghanistanAfricaAlbaniaArgentinaArmeniaAsiaAustraliaAustriaBahamasBangladeshBarbadosBelarusBelgiumBelizeBoliviaBosnia and HerzegovinaBrazilBulgariaBurma/MyanmarCabo VerdeCambodiaCameroonCanadaCaribbeanCentral AmericaChileChinaColombiaCongoCosta RicaCroatiaCubaCzechoslovakiaDenmarkDominicaDominican RepublicEastern AfricaEastern AsiaEastern EuropeEcuadorEgyptEl SalvadorEnglandEritreaEthiopiaEuropeFijiFranceGermanyGhanaGreeceGrenadaGuatemalaGuyanaHaitiHondurasHong KongHungaryIndiaIndonesiaIranIraqIrelandIsraelItalyJamaicaJapanJordanKazakhstanKenyaKoreaKuwaitLaosLatin AmericaLatviaLebanonLiberiaLithuaniaMalaysiaMexicoMicronesiaMiddle AfricaMoldovaMoroccoNepalNetherlandsNicaraguaNigeriaNorth AmericaNorth MacedoniaNorthern AfricaNorthern EuropeNorwayOceaniaPakistanPanamaPeruPhilippinesPolandPortugalRomaniaRussiaSaudi ArabiaScotlandSenegalSerbiaSierra LeoneSingaporeSomaliaSouth AfricaSouth AmericaSouth Central AsiaSouth Eastern AsiaSouthern EuropeSpainSri LankaSt. Vincent and the GrenadinesSudanSwedenSwitzerlandSyriaTaiwanThailandTrinidad and TobagoTurkeyUgandaUkraineUruguayUzbekistanVenezuelaVietnamWest IndiesWestern AfricaWestern AsiaWestern EuropeYemenZaireZimbabweAzores
Married-couple Households
Income
Poverty
Unemployment
Labor Participation
Family Structure
Vehicle Availability
Education Level
Disability

Married-couple Households Comparison

Chileans

Immigrants from South Eastern Asia

Exceptional
Exceptional
47.5%
MARRIED-COUPLE HOUSEHOLDS
92.2/ 100
METRIC RATING
119th/ 347
METRIC RANK
48.4%
MARRIED-COUPLE HOUSEHOLDS
98.9/ 100
METRIC RATING
68th/ 347
METRIC RANK

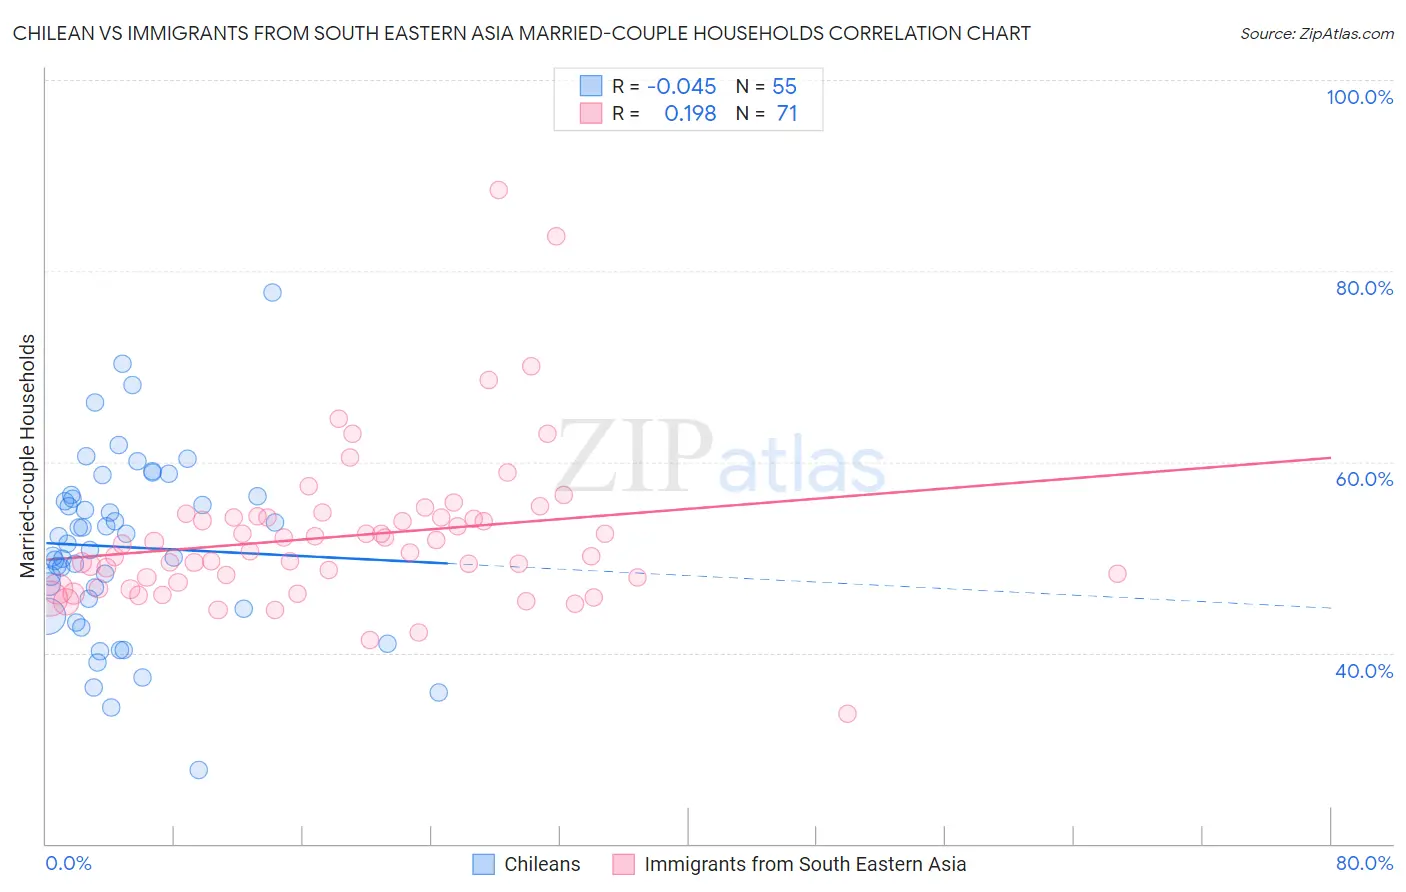
Chilean vs Immigrants from South Eastern Asia Married-couple Households Correlation Chart

The statistical analysis conducted on geographies consisting of 256,556,346 people shows no correlation between the proportion of Chileans and percentage of married-couple family households in the United States with a correlation coefficient (R) of -0.045 and weighted average of 47.5%. Similarly, the statistical analysis conducted on geographies consisting of 512,211,574 people shows a poor positive correlation between the proportion of Immigrants from South Eastern Asia and percentage of married-couple family households in the United States with a correlation coefficient (R) of 0.198 and weighted average of 48.4%, a difference of 1.9%.
Chilean vs Immigrants from South Eastern Asia Married-couple Households

Married-couple Households Correlation Summary

MeasurementChileanImmigrants from South Eastern Asia
Minimum27.7%33.6%
Maximum77.8%88.5%
Range50.1%54.9%
Mean51.1%52.2%
Median51.4%50.6%
Interquartile 25% (IQ1)44.6%47.4%
Interquartile 75% (IQ3)56.4%54.2%
Interquartile Range (IQR)11.8%6.9%
Standard Deviation (Sample)9.4%8.3%
Standard Deviation (Population)9.3%8.3%

Similar Demographics by Married-couple Households

Demographics Similar to Chileans by Married-couple Households

In terms of married-couple households, the demographic groups most similar to Chileans are French Canadian (47.5%, a difference of 0.030%), Immigrants from Germany (47.5%, a difference of 0.030%), Argentinean (47.5%, a difference of 0.050%), Slovak (47.6%, a difference of 0.10%), and Puget Sound Salish (47.4%, a difference of 0.19%).
DemographicsRating | RankMarried-couple Households
Peruvians
93.8
/100
|
#112
Exceptional
47.6%
Venezuelans
93.8
/100
|
#113
Exceptional
47.6%
Immigrants | Europe
93.7
/100
|
#114
Exceptional
47.6%
Slovaks
92.9
/100
|
#115
Exceptional
47.6%
Argentineans
92.5
/100
|
#116
Exceptional
47.5%
French Canadians
92.4
/100
|
#117
Exceptional
47.5%
Immigrants | Germany
92.4
/100
|
#118
Exceptional
47.5%
Chileans
92.2
/100
|
#119
Exceptional
47.5%
Puget Sound Salish
90.5
/100
|
#120
Exceptional
47.4%
Immigrants | Eastern Europe
90.3
/100
|
#121
Exceptional
47.4%
Okinawans
90.1
/100
|
#122
Exceptional
47.4%
Immigrants | Venezuela
89.3
/100
|
#123
Excellent
47.4%
Zimbabweans
89.2
/100
|
#124
Excellent
47.4%
Australians
89.0
/100
|
#125
Excellent
47.4%
Pakistanis
88.6
/100
|
#126
Excellent
47.3%

Demographics Similar to Immigrants from South Eastern Asia by Married-couple Households

In terms of married-couple households, the demographic groups most similar to Immigrants from South Eastern Asia are Immigrants from China (48.4%, a difference of 0.0%), Romanian (48.4%, a difference of 0.010%), Jordanian (48.4%, a difference of 0.020%), Immigrants from Canada (48.4%, a difference of 0.040%), and Immigrants from North America (48.4%, a difference of 0.040%).
DemographicsRating | RankMarried-couple Households
Bulgarians
99.1
/100
|
#61
Exceptional
48.5%
Luxembourgers
99.1
/100
|
#62
Exceptional
48.5%
Basques
99.0
/100
|
#63
Exceptional
48.4%
Northern Europeans
99.0
/100
|
#64
Exceptional
48.4%
Immigrants | Canada
99.0
/100
|
#65
Exceptional
48.4%
Jordanians
98.9
/100
|
#66
Exceptional
48.4%
Romanians
98.9
/100
|
#67
Exceptional
48.4%
Immigrants | South Eastern Asia
98.9
/100
|
#68
Exceptional
48.4%
Immigrants | China
98.9
/100
|
#69
Exceptional
48.4%
Immigrants | North America
98.9
/100
|
#70
Exceptional
48.4%
Laotians
98.8
/100
|
#71
Exceptional
48.4%
Scotch-Irish
98.6
/100
|
#72
Exceptional
48.3%
Immigrants | Singapore
98.6
/100
|
#73
Exceptional
48.3%
Immigrants | Romania
98.6
/100
|
#74
Exceptional
48.3%
Immigrants | England
98.4
/100
|
#75
Exceptional
48.2%