Chilean vs Salvadoran Average Family Size
COMPARE
Chilean
Salvadoran
Average Family Size
Average Family Size Comparison
Chileans
Salvadorans
3.23
AVERAGE FAMILY SIZE
53.2/ 100
METRIC RATING
171st/ 347
METRIC RANK
3.48
AVERAGE FAMILY SIZE
100.0/ 100
METRIC RATING
18th/ 347
METRIC RANK
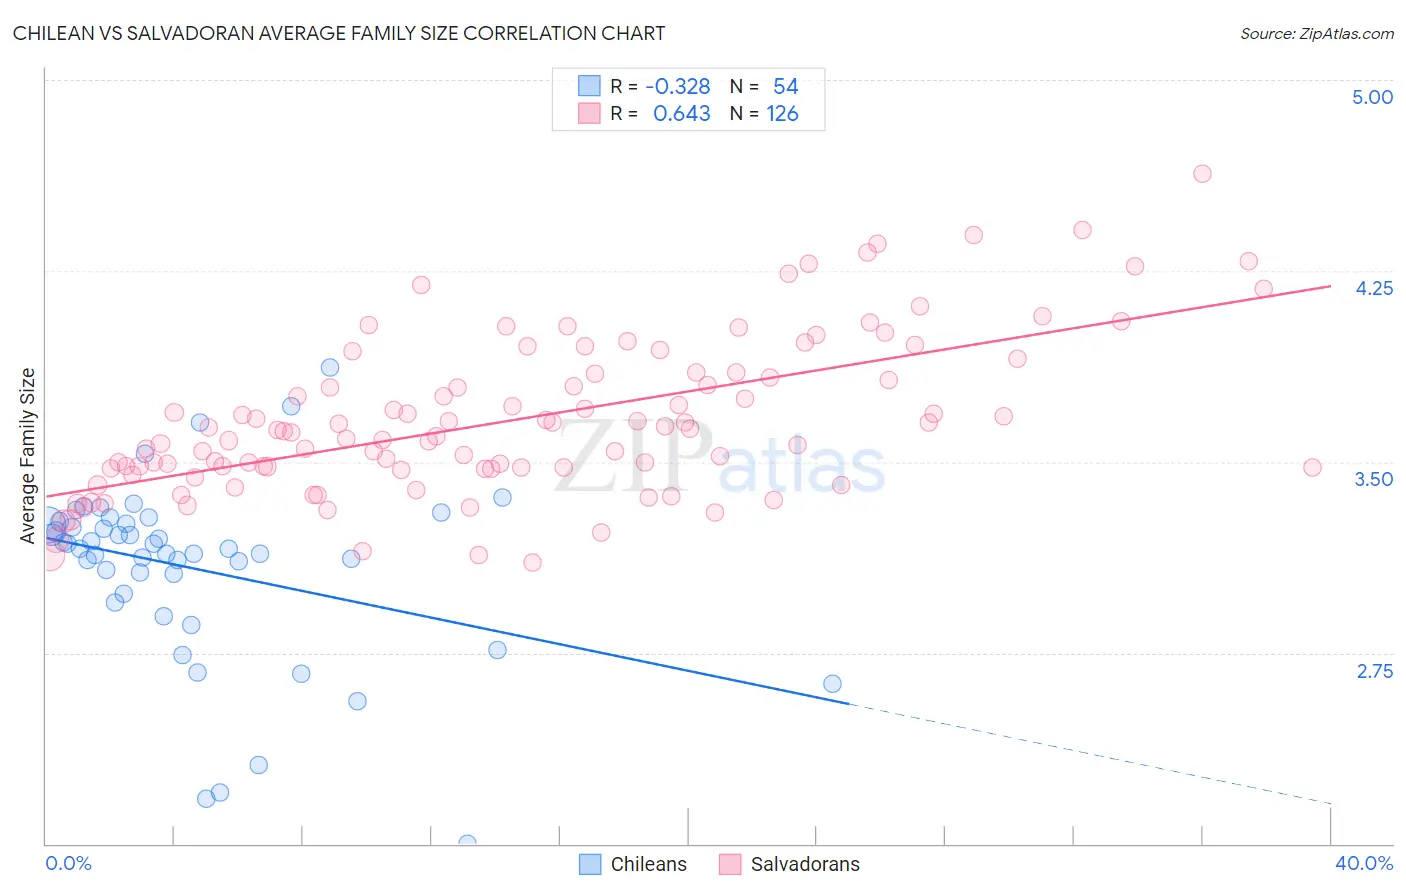
Chilean vs Salvadoran Average Family Size Correlation Chart
The statistical analysis conducted on geographies consisting of 256,563,974 people shows a mild negative correlation between the proportion of Chileans and average family size in the United States with a correlation coefficient (R) of -0.328 and weighted average of 3.23. Similarly, the statistical analysis conducted on geographies consisting of 398,698,929 people shows a significant positive correlation between the proportion of Salvadorans and average family size in the United States with a correlation coefficient (R) of 0.643 and weighted average of 3.48, a difference of 7.7%.
Average Family Size Correlation Summary
| Measurement | Chilean | Salvadoran |
| Minimum | 2.00 | 3.10 |
| Maximum | 3.87 | 4.63 |
| Range | 1.87 | 1.53 |
| Mean | 3.08 | 3.67 |
| Median | 3.16 | 3.62 |
| Interquartile 25% (IQ1) | 2.98 | 3.47 |
| Interquartile 75% (IQ3) | 3.26 | 3.85 |
| Interquartile Range (IQR) | 0.27 | 0.37 |
| Standard Deviation (Sample) | 0.36 | 0.31 |
| Standard Deviation (Population) | 0.35 | 0.31 |
Similar Demographics by Average Family Size
Demographics Similar to Chileans by Average Family Size
In terms of average family size, the demographic groups most similar to Chileans are Arab (3.23, a difference of 0.010%), Immigrants from Congo (3.23, a difference of 0.010%), Taiwanese (3.23, a difference of 0.020%), Aleut (3.23, a difference of 0.020%), and Immigrants from Uruguay (3.23, a difference of 0.020%).
| Demographics | Rating | Rank | Average Family Size |
| Egyptians | 58.6 /100 | #164 | Average 3.23 |
| Ugandans | 58.4 /100 | #165 | Average 3.23 |
| Immigrants | Senegal | 57.5 /100 | #166 | Average 3.23 |
| Dutch West Indians | 56.9 /100 | #167 | Average 3.23 |
| Taiwanese | 54.2 /100 | #168 | Average 3.23 |
| Aleuts | 54.1 /100 | #169 | Average 3.23 |
| Arabs | 53.8 /100 | #170 | Average 3.23 |
| Chileans | 53.2 /100 | #171 | Average 3.23 |
| Immigrants | Congo | 52.7 /100 | #172 | Average 3.23 |
| Immigrants | Uruguay | 52.0 /100 | #173 | Average 3.23 |
| Immigrants | South Central Asia | 50.0 /100 | #174 | Average 3.23 |
| Immigrants | China | 49.9 /100 | #175 | Average 3.23 |
| Israelis | 48.7 /100 | #176 | Average 3.23 |
| Argentineans | 47.4 /100 | #177 | Average 3.23 |
| Spaniards | 47.2 /100 | #178 | Average 3.23 |
Demographics Similar to Salvadorans by Average Family Size
In terms of average family size, the demographic groups most similar to Salvadorans are Mexican (3.48, a difference of 0.070%), Cheyenne (3.47, a difference of 0.11%), Immigrants from El Salvador (3.49, a difference of 0.25%), Ute (3.49, a difference of 0.34%), and Yuman (3.47, a difference of 0.36%).
| Demographics | Rating | Rank | Average Family Size |
| Tohono O'odham | 100.0 /100 | #11 | Exceptional 3.53 |
| Immigrants | Mexico | 100.0 /100 | #12 | Exceptional 3.52 |
| Sioux | 100.0 /100 | #13 | Exceptional 3.52 |
| Immigrants | Central America | 100.0 /100 | #14 | Exceptional 3.49 |
| Tongans | 100.0 /100 | #15 | Exceptional 3.49 |
| Ute | 100.0 /100 | #16 | Exceptional 3.49 |
| Immigrants | El Salvador | 100.0 /100 | #17 | Exceptional 3.49 |
| Salvadorans | 100.0 /100 | #18 | Exceptional 3.48 |
| Mexicans | 100.0 /100 | #19 | Exceptional 3.48 |
| Cheyenne | 100.0 /100 | #20 | Exceptional 3.47 |
| Yuman | 100.0 /100 | #21 | Exceptional 3.47 |
| Apache | 100.0 /100 | #22 | Exceptional 3.46 |
| Immigrants | Fiji | 100.0 /100 | #23 | Exceptional 3.45 |
| Natives/Alaskans | 100.0 /100 | #24 | Exceptional 3.45 |
| Yakama | 100.0 /100 | #25 | Exceptional 3.45 |