Chilean vs Immigrants from Czechoslovakia Single Father Households
COMPARE
Chilean
Immigrants from Czechoslovakia
Single Father Households
Single Father Households Comparison
Chileans
Immigrants from Czechoslovakia
2.2%
SINGLE FATHER HOUSEHOLDS
94.5/ 100
METRIC RATING
136th/ 347
METRIC RANK
2.0%
SINGLE FATHER HOUSEHOLDS
99.9/ 100
METRIC RATING
58th/ 347
METRIC RANK
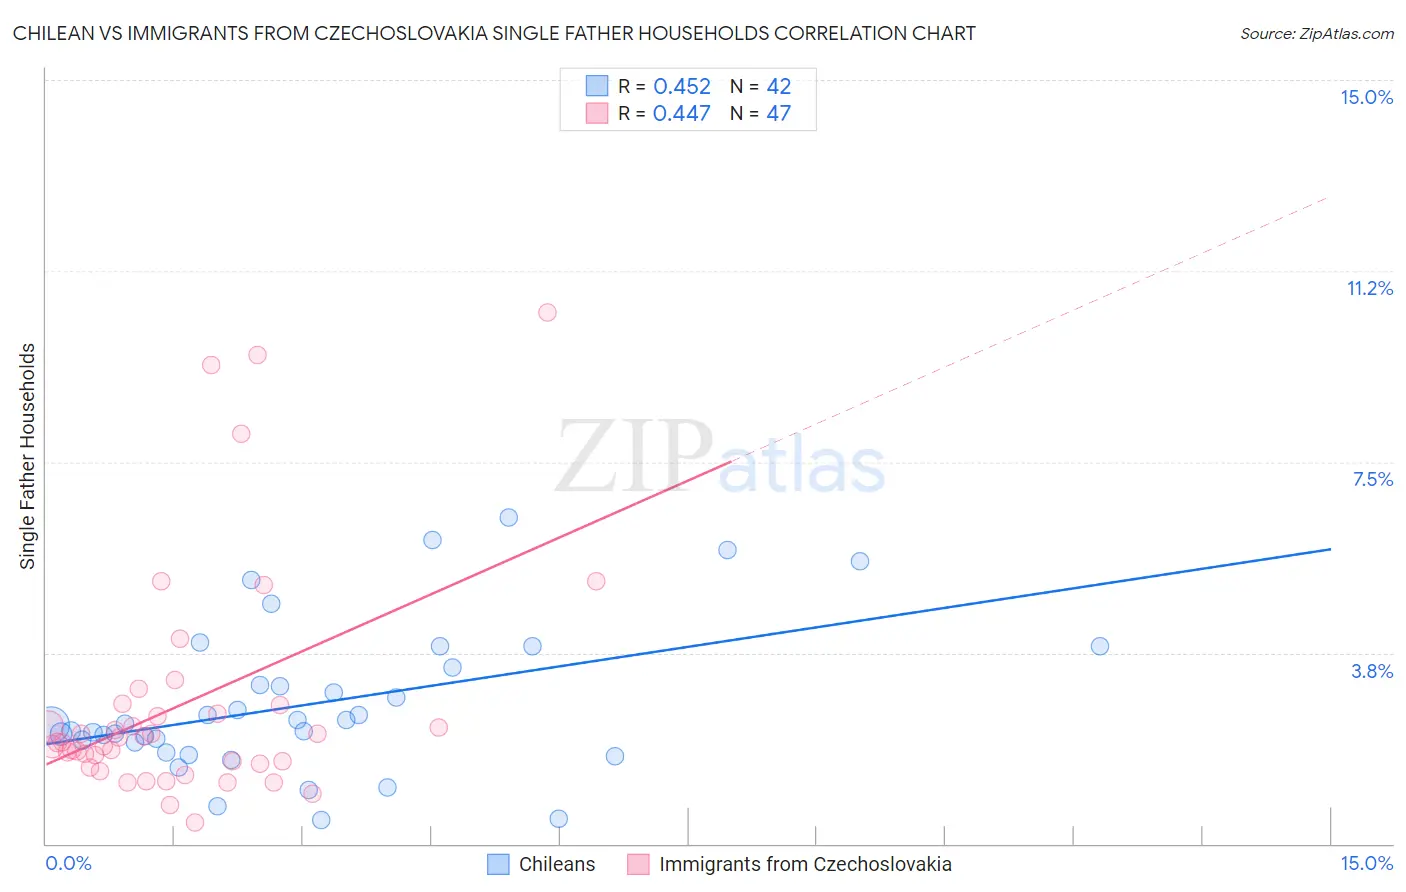
Chilean vs Immigrants from Czechoslovakia Single Father Households Correlation Chart
The statistical analysis conducted on geographies consisting of 255,538,332 people shows a moderate positive correlation between the proportion of Chileans and percentage of single father households in the United States with a correlation coefficient (R) of 0.452 and weighted average of 2.2%. Similarly, the statistical analysis conducted on geographies consisting of 194,565,080 people shows a moderate positive correlation between the proportion of Immigrants from Czechoslovakia and percentage of single father households in the United States with a correlation coefficient (R) of 0.447 and weighted average of 2.0%, a difference of 8.9%.
Single Father Households Correlation Summary
| Measurement | Chilean | Immigrants from Czechoslovakia |
| Minimum | 0.46% | 0.41% |
| Maximum | 6.4% | 10.4% |
| Range | 6.0% | 10.0% |
| Mean | 2.7% | 2.8% |
| Median | 2.3% | 2.0% |
| Interquartile 25% (IQ1) | 2.0% | 1.6% |
| Interquartile 75% (IQ3) | 3.5% | 2.7% |
| Interquartile Range (IQR) | 1.5% | 1.2% |
| Standard Deviation (Sample) | 1.5% | 2.3% |
| Standard Deviation (Population) | 1.4% | 2.3% |
Similar Demographics by Single Father Households
Demographics Similar to Chileans by Single Father Households
In terms of single father households, the demographic groups most similar to Chileans are Austrian (2.2%, a difference of 0.11%), Syrian (2.2%, a difference of 0.12%), West Indian (2.2%, a difference of 0.14%), Zimbabwean (2.2%, a difference of 0.23%), and Brazilian (2.2%, a difference of 0.56%).
| Demographics | Rating | Rank | Single Father Households |
| Serbians | 96.8 /100 | #129 | Exceptional 2.2% |
| Immigrants | Chile | 96.7 /100 | #130 | Exceptional 2.2% |
| Immigrants | Jordan | 96.6 /100 | #131 | Exceptional 2.2% |
| Poles | 96.5 /100 | #132 | Exceptional 2.2% |
| Taiwanese | 96.3 /100 | #133 | Exceptional 2.2% |
| Zimbabweans | 95.1 /100 | #134 | Exceptional 2.2% |
| Syrians | 94.8 /100 | #135 | Exceptional 2.2% |
| Chileans | 94.5 /100 | #136 | Exceptional 2.2% |
| Austrians | 94.2 /100 | #137 | Exceptional 2.2% |
| West Indians | 94.1 /100 | #138 | Exceptional 2.2% |
| Brazilians | 92.8 /100 | #139 | Exceptional 2.2% |
| British | 92.8 /100 | #140 | Exceptional 2.2% |
| Laotians | 92.5 /100 | #141 | Exceptional 2.2% |
| Luxembourgers | 92.3 /100 | #142 | Exceptional 2.2% |
| Immigrants | Nepal | 92.1 /100 | #143 | Exceptional 2.2% |
Demographics Similar to Immigrants from Czechoslovakia by Single Father Households
In terms of single father households, the demographic groups most similar to Immigrants from Czechoslovakia are Burmese (2.0%, a difference of 0.020%), Immigrants from North Macedonia (2.0%, a difference of 0.11%), Immigrants from Austria (2.0%, a difference of 0.11%), Immigrants from Norway (2.0%, a difference of 0.29%), and Immigrants from France (2.0%, a difference of 0.31%).
| Demographics | Rating | Rank | Single Father Households |
| Immigrants | Poland | 99.9 /100 | #51 | Exceptional 2.0% |
| Immigrants | Europe | 99.9 /100 | #52 | Exceptional 2.0% |
| Immigrants | Northern Europe | 99.9 /100 | #53 | Exceptional 2.0% |
| Immigrants | Korea | 99.9 /100 | #54 | Exceptional 2.0% |
| Immigrants | France | 99.9 /100 | #55 | Exceptional 2.0% |
| Immigrants | Norway | 99.9 /100 | #56 | Exceptional 2.0% |
| Burmese | 99.9 /100 | #57 | Exceptional 2.0% |
| Immigrants | Czechoslovakia | 99.9 /100 | #58 | Exceptional 2.0% |
| Immigrants | North Macedonia | 99.9 /100 | #59 | Exceptional 2.0% |
| Immigrants | Austria | 99.9 /100 | #60 | Exceptional 2.0% |
| Vietnamese | 99.9 /100 | #61 | Exceptional 2.0% |
| Immigrants | Malaysia | 99.9 /100 | #62 | Exceptional 2.0% |
| Maltese | 99.9 /100 | #63 | Exceptional 2.0% |
| Mongolians | 99.9 /100 | #64 | Exceptional 2.1% |
| Paraguayans | 99.9 /100 | #65 | Exceptional 2.1% |