Chilean vs Ukrainian Single Father Households
COMPARE
Chilean
Ukrainian
Single Father Households
Single Father Households Comparison
Chileans
Ukrainians
2.2%
SINGLE FATHER HOUSEHOLDS
94.5/ 100
METRIC RATING
136th/ 347
METRIC RANK
2.1%
SINGLE FATHER HOUSEHOLDS
99.3/ 100
METRIC RATING
94th/ 347
METRIC RANK
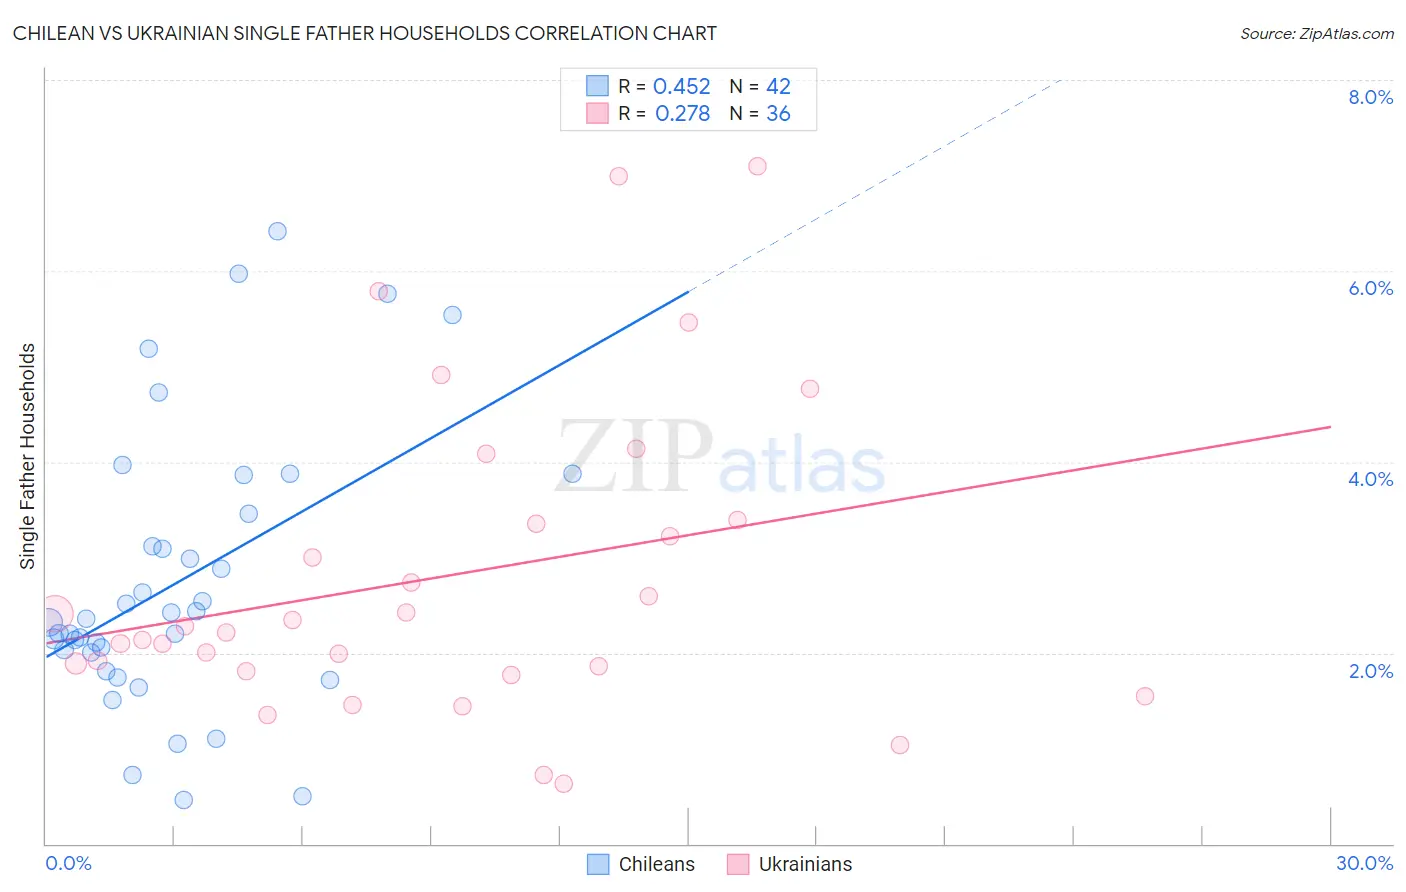
Chilean vs Ukrainian Single Father Households Correlation Chart
The statistical analysis conducted on geographies consisting of 255,538,332 people shows a moderate positive correlation between the proportion of Chileans and percentage of single father households in the United States with a correlation coefficient (R) of 0.452 and weighted average of 2.2%. Similarly, the statistical analysis conducted on geographies consisting of 442,446,629 people shows a weak positive correlation between the proportion of Ukrainians and percentage of single father households in the United States with a correlation coefficient (R) of 0.278 and weighted average of 2.1%, a difference of 4.3%.
Single Father Households Correlation Summary
| Measurement | Chilean | Ukrainian |
| Minimum | 0.46% | 0.63% |
| Maximum | 6.4% | 7.1% |
| Range | 6.0% | 6.5% |
| Mean | 2.7% | 2.8% |
| Median | 2.3% | 2.2% |
| Interquartile 25% (IQ1) | 2.0% | 1.8% |
| Interquartile 75% (IQ3) | 3.5% | 3.4% |
| Interquartile Range (IQR) | 1.5% | 1.5% |
| Standard Deviation (Sample) | 1.5% | 1.6% |
| Standard Deviation (Population) | 1.4% | 1.6% |
Similar Demographics by Single Father Households
Demographics Similar to Chileans by Single Father Households
In terms of single father households, the demographic groups most similar to Chileans are Austrian (2.2%, a difference of 0.11%), Syrian (2.2%, a difference of 0.12%), West Indian (2.2%, a difference of 0.14%), Zimbabwean (2.2%, a difference of 0.23%), and Brazilian (2.2%, a difference of 0.56%).
| Demographics | Rating | Rank | Single Father Households |
| Serbians | 96.8 /100 | #129 | Exceptional 2.2% |
| Immigrants | Chile | 96.7 /100 | #130 | Exceptional 2.2% |
| Immigrants | Jordan | 96.6 /100 | #131 | Exceptional 2.2% |
| Poles | 96.5 /100 | #132 | Exceptional 2.2% |
| Taiwanese | 96.3 /100 | #133 | Exceptional 2.2% |
| Zimbabweans | 95.1 /100 | #134 | Exceptional 2.2% |
| Syrians | 94.8 /100 | #135 | Exceptional 2.2% |
| Chileans | 94.5 /100 | #136 | Exceptional 2.2% |
| Austrians | 94.2 /100 | #137 | Exceptional 2.2% |
| West Indians | 94.1 /100 | #138 | Exceptional 2.2% |
| Brazilians | 92.8 /100 | #139 | Exceptional 2.2% |
| British | 92.8 /100 | #140 | Exceptional 2.2% |
| Laotians | 92.5 /100 | #141 | Exceptional 2.2% |
| Luxembourgers | 92.3 /100 | #142 | Exceptional 2.2% |
| Immigrants | Nepal | 92.1 /100 | #143 | Exceptional 2.2% |
Demographics Similar to Ukrainians by Single Father Households
In terms of single father households, the demographic groups most similar to Ukrainians are Croatian (2.1%, a difference of 0.0%), Romanian (2.1%, a difference of 0.11%), Immigrants from Guyana (2.1%, a difference of 0.20%), Bermudan (2.1%, a difference of 0.22%), and Arab (2.1%, a difference of 0.37%).
| Demographics | Rating | Rank | Single Father Households |
| Lithuanians | 99.5 /100 | #87 | Exceptional 2.1% |
| Bhutanese | 99.5 /100 | #88 | Exceptional 2.1% |
| Immigrants | Armenia | 99.5 /100 | #89 | Exceptional 2.1% |
| Immigrants | Pakistan | 99.5 /100 | #90 | Exceptional 2.1% |
| Immigrants | Guyana | 99.4 /100 | #91 | Exceptional 2.1% |
| Romanians | 99.4 /100 | #92 | Exceptional 2.1% |
| Croatians | 99.3 /100 | #93 | Exceptional 2.1% |
| Ukrainians | 99.3 /100 | #94 | Exceptional 2.1% |
| Bermudans | 99.2 /100 | #95 | Exceptional 2.1% |
| Arabs | 99.2 /100 | #96 | Exceptional 2.1% |
| Immigrants | Moldova | 99.1 /100 | #97 | Exceptional 2.1% |
| Guyanese | 99.1 /100 | #98 | Exceptional 2.1% |
| South Africans | 99.1 /100 | #99 | Exceptional 2.1% |
| Immigrants | Northern Africa | 99.0 /100 | #100 | Exceptional 2.1% |
| Immigrants | Western Europe | 98.9 /100 | #101 | Exceptional 2.1% |