Chilean vs Immigrants from Micronesia In Labor Force | Age 16-19
COMPARE
Chilean
Immigrants from Micronesia
In Labor Force | Age 16-19
In Labor Force | Age 16-19 Comparison
Chileans
Immigrants from Micronesia
35.8%
IN LABOR FORCE | AGE 16-19
14.6/ 100
METRIC RATING
206th/ 347
METRIC RANK
40.2%
IN LABOR FORCE | AGE 16-19
100.0/ 100
METRIC RATING
64th/ 347
METRIC RANK
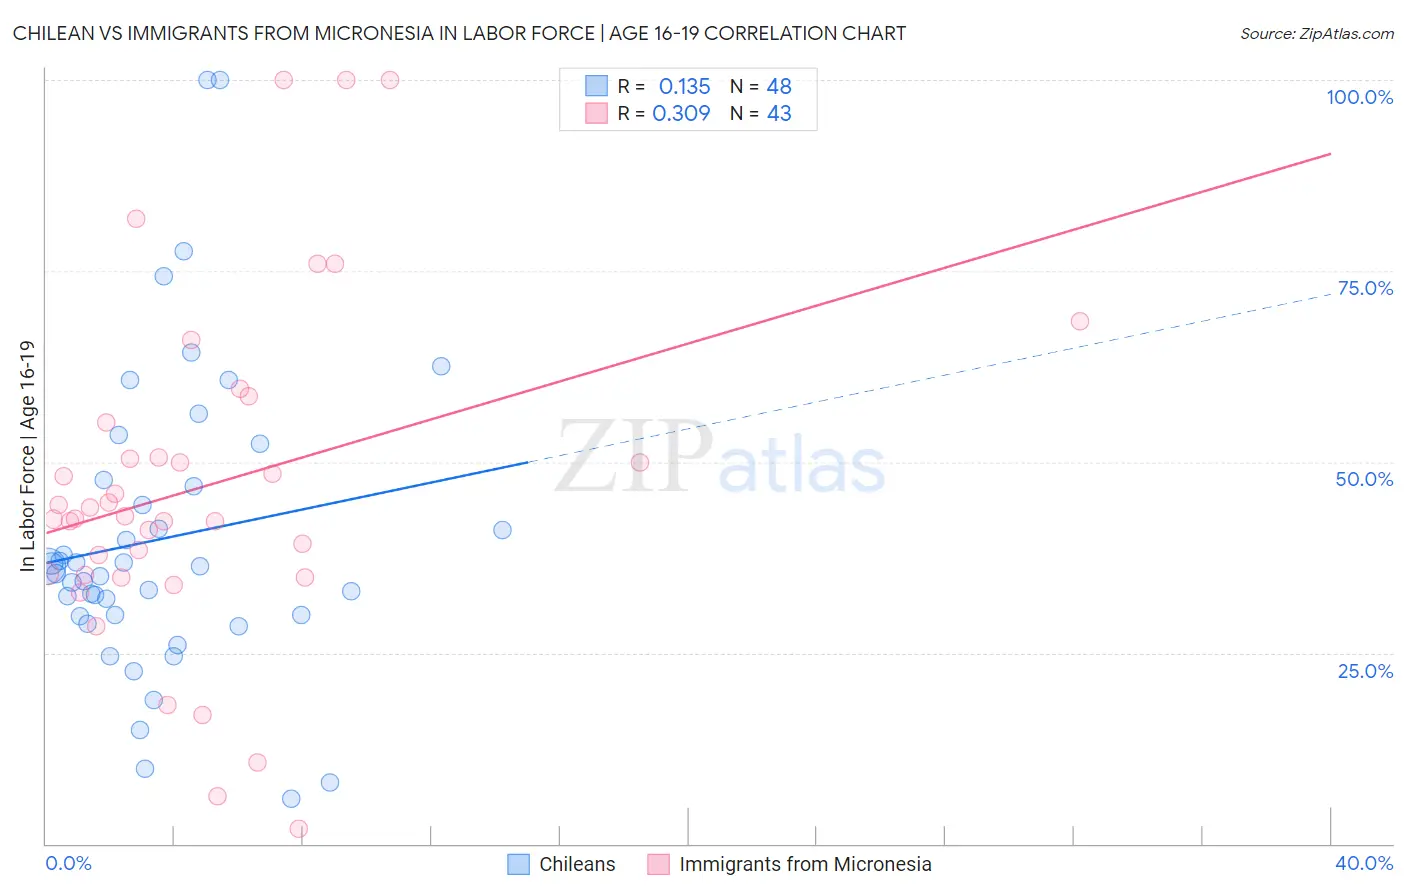
Chilean vs Immigrants from Micronesia In Labor Force | Age 16-19 Correlation Chart
The statistical analysis conducted on geographies consisting of 256,483,871 people shows a poor positive correlation between the proportion of Chileans and labor force participation rate among population between the ages 16 and 19 in the United States with a correlation coefficient (R) of 0.135 and weighted average of 35.8%. Similarly, the statistical analysis conducted on geographies consisting of 61,545,841 people shows a mild positive correlation between the proportion of Immigrants from Micronesia and labor force participation rate among population between the ages 16 and 19 in the United States with a correlation coefficient (R) of 0.309 and weighted average of 40.2%, a difference of 12.3%.
In Labor Force | Age 16-19 Correlation Summary
| Measurement | Chilean | Immigrants from Micronesia |
| Minimum | 5.9% | 1.9% |
| Maximum | 100.0% | 100.0% |
| Range | 94.1% | 98.1% |
| Mean | 40.0% | 46.9% |
| Median | 35.8% | 42.9% |
| Interquartile 25% (IQ1) | 29.8% | 35.2% |
| Interquartile 75% (IQ3) | 47.2% | 55.2% |
| Interquartile Range (IQR) | 17.4% | 20.0% |
| Standard Deviation (Sample) | 20.0% | 22.3% |
| Standard Deviation (Population) | 19.7% | 22.1% |
Similar Demographics by In Labor Force | Age 16-19
Demographics Similar to Chileans by In Labor Force | Age 16-19
In terms of in labor force | age 16-19, the demographic groups most similar to Chileans are South American Indian (35.8%, a difference of 0.0%), Immigrants from Eastern Europe (35.8%, a difference of 0.020%), Immigrants from Albania (35.8%, a difference of 0.040%), Korean (35.7%, a difference of 0.14%), and Immigrants from Nigeria (35.8%, a difference of 0.21%).
| Demographics | Rating | Rank | In Labor Force | Age 16-19 |
| Immigrants | Norway | 19.8 /100 | #199 | Poor 35.9% |
| Immigrants | Sweden | 18.8 /100 | #200 | Poor 35.9% |
| Alsatians | 17.5 /100 | #201 | Poor 35.9% |
| Senegalese | 17.4 /100 | #202 | Poor 35.9% |
| Immigrants | Nigeria | 16.8 /100 | #203 | Poor 35.8% |
| Immigrants | Albania | 15.0 /100 | #204 | Poor 35.8% |
| South American Indians | 14.6 /100 | #205 | Poor 35.8% |
| Chileans | 14.6 /100 | #206 | Poor 35.8% |
| Immigrants | Eastern Europe | 14.5 /100 | #207 | Poor 35.8% |
| Koreans | 13.3 /100 | #208 | Poor 35.7% |
| Moroccans | 12.7 /100 | #209 | Poor 35.7% |
| Immigrants | Switzerland | 11.9 /100 | #210 | Poor 35.6% |
| Mexicans | 11.9 /100 | #211 | Poor 35.6% |
| Houma | 11.0 /100 | #212 | Poor 35.6% |
| Immigrants | Bolivia | 11.0 /100 | #213 | Poor 35.6% |
Demographics Similar to Immigrants from Micronesia by In Labor Force | Age 16-19
In terms of in labor force | age 16-19, the demographic groups most similar to Immigrants from Micronesia are Kenyan (40.1%, a difference of 0.080%), Northern European (40.2%, a difference of 0.12%), Cherokee (40.2%, a difference of 0.17%), Nonimmigrants (40.1%, a difference of 0.20%), and Canadian (40.1%, a difference of 0.21%).
| Demographics | Rating | Rank | In Labor Force | Age 16-19 |
| Lithuanians | 100.0 /100 | #57 | Exceptional 40.4% |
| Aleuts | 100.0 /100 | #58 | Exceptional 40.4% |
| Slavs | 100.0 /100 | #59 | Exceptional 40.4% |
| Immigrants | Eastern Africa | 100.0 /100 | #60 | Exceptional 40.4% |
| Americans | 100.0 /100 | #61 | Exceptional 40.3% |
| Cherokee | 100.0 /100 | #62 | Exceptional 40.2% |
| Northern Europeans | 100.0 /100 | #63 | Exceptional 40.2% |
| Immigrants | Micronesia | 100.0 /100 | #64 | Exceptional 40.2% |
| Kenyans | 100.0 /100 | #65 | Exceptional 40.1% |
| Immigrants | Nonimmigrants | 100.0 /100 | #66 | Exceptional 40.1% |
| Canadians | 100.0 /100 | #67 | Exceptional 40.1% |
| Italians | 99.9 /100 | #68 | Exceptional 40.1% |
| Potawatomi | 99.9 /100 | #69 | Exceptional 40.0% |
| Portuguese | 99.9 /100 | #70 | Exceptional 40.0% |
| Serbians | 99.9 /100 | #71 | Exceptional 39.9% |