Panamanian vs Immigrants from Hungary Currently Married
COMPARE
Panamanian
Immigrants from Hungary
Currently Married
Currently Married Comparison
Panamanians
Immigrants from Hungary
45.3%
CURRENTLY MARRIED
4.0/ 100
METRIC RATING
218th/ 347
METRIC RANK
47.6%
CURRENTLY MARRIED
91.2/ 100
METRIC RATING
111th/ 347
METRIC RANK
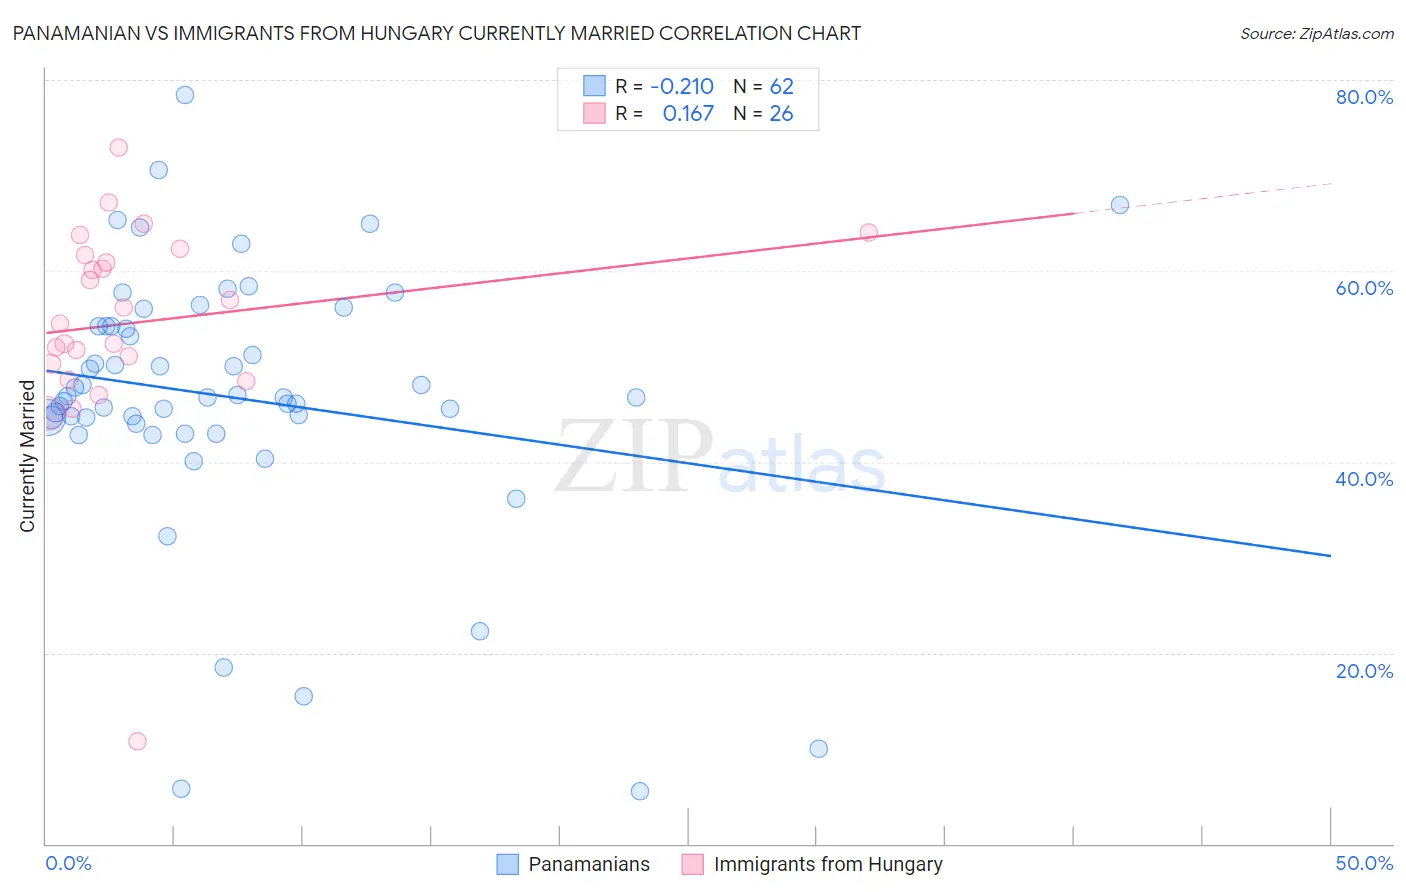
Panamanian vs Immigrants from Hungary Currently Married Correlation Chart
The statistical analysis conducted on geographies consisting of 281,208,339 people shows a weak negative correlation between the proportion of Panamanians and percentage of population currently married in the United States with a correlation coefficient (R) of -0.210 and weighted average of 45.3%. Similarly, the statistical analysis conducted on geographies consisting of 195,704,410 people shows a poor positive correlation between the proportion of Immigrants from Hungary and percentage of population currently married in the United States with a correlation coefficient (R) of 0.167 and weighted average of 47.6%, a difference of 5.2%.
Currently Married Correlation Summary
| Measurement | Panamanian | Immigrants from Hungary |
| Minimum | 5.5% | 10.7% |
| Maximum | 78.4% | 72.9% |
| Range | 72.9% | 62.2% |
| Mean | 46.8% | 54.6% |
| Median | 46.8% | 55.3% |
| Interquartile 25% (IQ1) | 44.6% | 50.3% |
| Interquartile 75% (IQ3) | 54.2% | 61.7% |
| Interquartile Range (IQR) | 9.5% | 11.4% |
| Standard Deviation (Sample) | 14.0% | 11.5% |
| Standard Deviation (Population) | 13.9% | 11.3% |
Similar Demographics by Currently Married
Demographics Similar to Panamanians by Currently Married
In terms of currently married, the demographic groups most similar to Panamanians are Immigrants from Portugal (45.2%, a difference of 0.12%), Immigrants from Thailand (45.4%, a difference of 0.24%), Kenyan (45.2%, a difference of 0.24%), Mexican (45.2%, a difference of 0.26%), and Immigrants from Morocco (45.4%, a difference of 0.33%).
| Demographics | Rating | Rank | Currently Married |
| Houma | 7.2 /100 | #211 | Tragic 45.5% |
| Marshallese | 7.2 /100 | #212 | Tragic 45.5% |
| Alaska Natives | 7.0 /100 | #213 | Tragic 45.5% |
| Dutch West Indians | 6.7 /100 | #214 | Tragic 45.5% |
| German Russians | 6.7 /100 | #215 | Tragic 45.5% |
| Immigrants | Morocco | 5.5 /100 | #216 | Tragic 45.4% |
| Immigrants | Thailand | 5.1 /100 | #217 | Tragic 45.4% |
| Panamanians | 4.0 /100 | #218 | Tragic 45.3% |
| Immigrants | Portugal | 3.5 /100 | #219 | Tragic 45.2% |
| Kenyans | 3.1 /100 | #220 | Tragic 45.2% |
| Mexicans | 3.0 /100 | #221 | Tragic 45.2% |
| Immigrants | Azores | 2.5 /100 | #222 | Tragic 45.1% |
| Immigrants | Laos | 2.3 /100 | #223 | Tragic 45.0% |
| Immigrants | Uganda | 2.2 /100 | #224 | Tragic 45.0% |
| French American Indians | 2.2 /100 | #225 | Tragic 45.0% |
Demographics Similar to Immigrants from Hungary by Currently Married
In terms of currently married, the demographic groups most similar to Immigrants from Hungary are Immigrants from Western Europe (47.6%, a difference of 0.010%), Immigrants from Denmark (47.6%, a difference of 0.040%), South African (47.6%, a difference of 0.070%), Immigrants from Indonesia (47.6%, a difference of 0.070%), and Palestinian (47.6%, a difference of 0.080%).
| Demographics | Rating | Rank | Currently Married |
| Serbians | 93.6 /100 | #104 | Exceptional 47.8% |
| Immigrants | Singapore | 93.3 /100 | #105 | Exceptional 47.8% |
| Immigrants | Greece | 93.1 /100 | #106 | Exceptional 47.7% |
| Immigrants | Italy | 92.9 /100 | #107 | Exceptional 47.7% |
| Tsimshian | 92.4 /100 | #108 | Exceptional 47.7% |
| Immigrants | Egypt | 92.3 /100 | #109 | Exceptional 47.7% |
| Immigrants | Russia | 92.0 /100 | #110 | Exceptional 47.7% |
| Immigrants | Hungary | 91.2 /100 | #111 | Exceptional 47.6% |
| Immigrants | Western Europe | 91.1 /100 | #112 | Exceptional 47.6% |
| Immigrants | Denmark | 90.9 /100 | #113 | Exceptional 47.6% |
| South Africans | 90.5 /100 | #114 | Exceptional 47.6% |
| Immigrants | Indonesia | 90.5 /100 | #115 | Exceptional 47.6% |
| Palestinians | 90.4 /100 | #116 | Exceptional 47.6% |
| Puget Sound Salish | 90.3 /100 | #117 | Exceptional 47.6% |
| Immigrants | Philippines | 90.2 /100 | #118 | Exceptional 47.6% |