Chickasaw vs Immigrants from Brazil In Labor Force | Age 35-44
COMPARE
Chickasaw
Immigrants from Brazil
In Labor Force | Age 35-44
In Labor Force | Age 35-44 Comparison
Chickasaw
Immigrants from Brazil
80.9%
IN LABOR FORCE | AGE 35-44
0.0/ 100
METRIC RATING
320th/ 347
METRIC RANK
85.0%
IN LABOR FORCE | AGE 35-44
99.2/ 100
METRIC RATING
65th/ 347
METRIC RANK
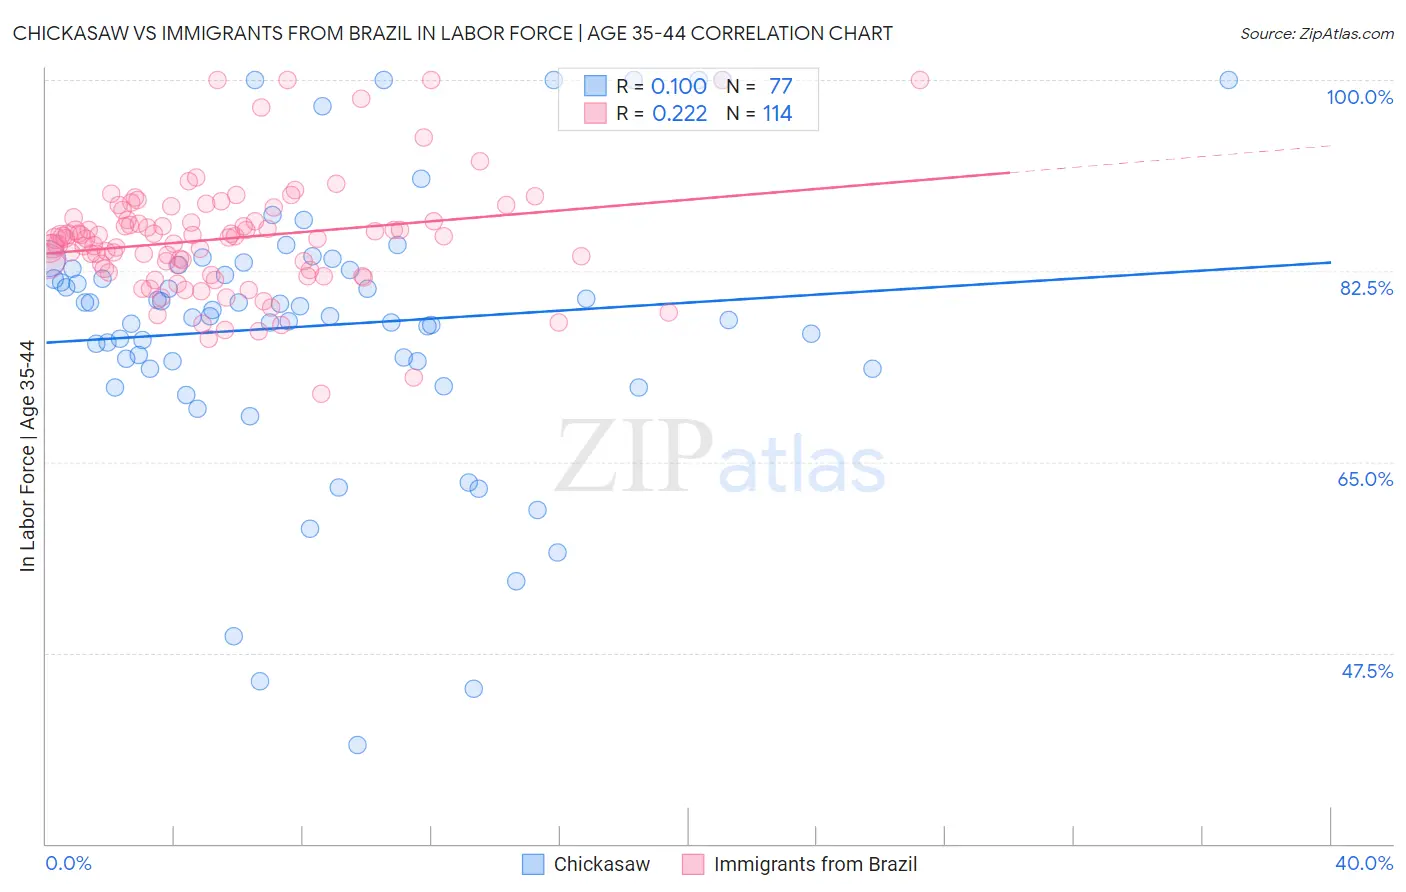
Chickasaw vs Immigrants from Brazil In Labor Force | Age 35-44 Correlation Chart
The statistical analysis conducted on geographies consisting of 147,707,163 people shows a slight positive correlation between the proportion of Chickasaw and labor force participation rate among population between the ages 35 and 44 in the United States with a correlation coefficient (R) of 0.100 and weighted average of 80.9%. Similarly, the statistical analysis conducted on geographies consisting of 342,874,628 people shows a weak positive correlation between the proportion of Immigrants from Brazil and labor force participation rate among population between the ages 35 and 44 in the United States with a correlation coefficient (R) of 0.222 and weighted average of 85.0%, a difference of 5.1%.
In Labor Force | Age 35-44 Correlation Summary
| Measurement | Chickasaw | Immigrants from Brazil |
| Minimum | 39.0% | 71.2% |
| Maximum | 100.0% | 100.0% |
| Range | 61.0% | 28.8% |
| Mean | 77.5% | 85.5% |
| Median | 78.4% | 85.5% |
| Interquartile 25% (IQ1) | 73.9% | 82.6% |
| Interquartile 75% (IQ3) | 82.9% | 87.1% |
| Interquartile Range (IQR) | 9.0% | 4.5% |
| Standard Deviation (Sample) | 12.5% | 5.2% |
| Standard Deviation (Population) | 12.5% | 5.2% |
Similar Demographics by In Labor Force | Age 35-44
Demographics Similar to Chickasaw by In Labor Force | Age 35-44
In terms of in labor force | age 35-44, the demographic groups most similar to Chickasaw are Inupiat (80.9%, a difference of 0.050%), Puerto Rican (80.7%, a difference of 0.28%), Paiute (80.6%, a difference of 0.35%), Yaqui (80.5%, a difference of 0.46%), and Choctaw (80.5%, a difference of 0.47%).
| Demographics | Rating | Rank | In Labor Force | Age 35-44 |
| Mexicans | 0.0 /100 | #313 | Tragic 81.6% |
| Cajuns | 0.0 /100 | #314 | Tragic 81.5% |
| Immigrants | Mexico | 0.0 /100 | #315 | Tragic 81.5% |
| Comanche | 0.0 /100 | #316 | Tragic 81.5% |
| Cherokee | 0.0 /100 | #317 | Tragic 81.4% |
| Alaskan Athabascans | 0.0 /100 | #318 | Tragic 81.3% |
| Inupiat | 0.0 /100 | #319 | Tragic 80.9% |
| Chickasaw | 0.0 /100 | #320 | Tragic 80.9% |
| Puerto Ricans | 0.0 /100 | #321 | Tragic 80.7% |
| Paiute | 0.0 /100 | #322 | Tragic 80.6% |
| Yaqui | 0.0 /100 | #323 | Tragic 80.5% |
| Choctaw | 0.0 /100 | #324 | Tragic 80.5% |
| Dutch West Indians | 0.0 /100 | #325 | Tragic 80.4% |
| Seminole | 0.0 /100 | #326 | Tragic 80.4% |
| Sioux | 0.0 /100 | #327 | Tragic 80.2% |
Demographics Similar to Immigrants from Brazil by In Labor Force | Age 35-44
In terms of in labor force | age 35-44, the demographic groups most similar to Immigrants from Brazil are Immigrants from Haiti (85.0%, a difference of 0.0%), Swedish (85.0%, a difference of 0.010%), Immigrants from Italy (85.0%, a difference of 0.010%), Immigrants from Moldova (85.0%, a difference of 0.020%), and Immigrants from Uganda (85.0%, a difference of 0.020%).
| Demographics | Rating | Rank | In Labor Force | Age 35-44 |
| Slovaks | 99.4 /100 | #58 | Exceptional 85.1% |
| Serbians | 99.4 /100 | #59 | Exceptional 85.1% |
| Albanians | 99.4 /100 | #60 | Exceptional 85.1% |
| Immigrants | Latvia | 99.3 /100 | #61 | Exceptional 85.0% |
| Immigrants | Moldova | 99.3 /100 | #62 | Exceptional 85.0% |
| Immigrants | Uganda | 99.3 /100 | #63 | Exceptional 85.0% |
| Swedes | 99.2 /100 | #64 | Exceptional 85.0% |
| Immigrants | Brazil | 99.2 /100 | #65 | Exceptional 85.0% |
| Immigrants | Haiti | 99.1 /100 | #66 | Exceptional 85.0% |
| Immigrants | Italy | 99.1 /100 | #67 | Exceptional 85.0% |
| Italians | 99.1 /100 | #68 | Exceptional 85.0% |
| Sudanese | 99.0 /100 | #69 | Exceptional 85.0% |
| Brazilians | 99.0 /100 | #70 | Exceptional 85.0% |
| Russians | 99.0 /100 | #71 | Exceptional 85.0% |
| Immigrants | Singapore | 98.9 /100 | #72 | Exceptional 85.0% |